. 2010 May 25;107(21):9801-6.
doi: 10.1073/pnas.0914118107. Epub 2010 May 10.

Concerted action of wild-type and mutant TNF receptors enhances inflammation in TNF receptor 1-associated periodic fever syndrome

Affiliations

Concerted action of wild-type and mutant TNF receptors enhances inflammation in TNF receptor 1-associated periodic fever syndrome

Anna Simon et al. Proc Natl Acad Sci U S A. .

Abstract

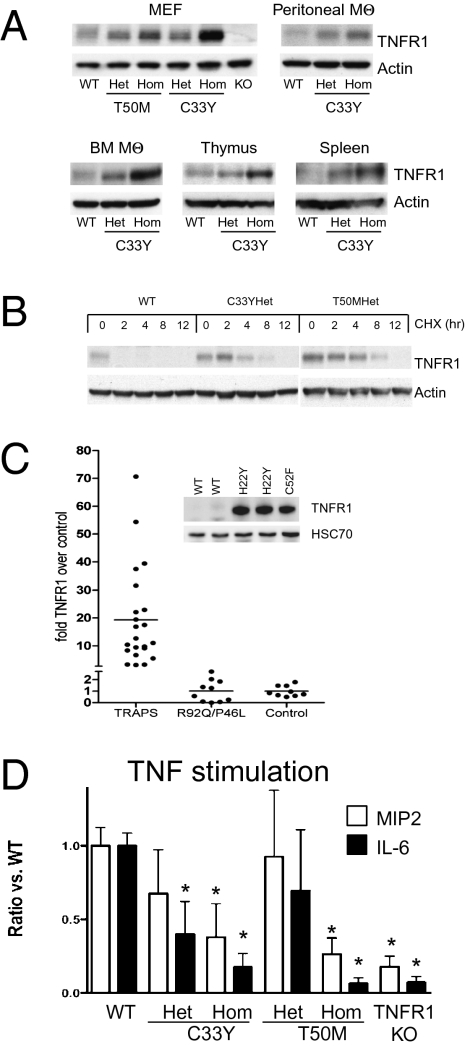
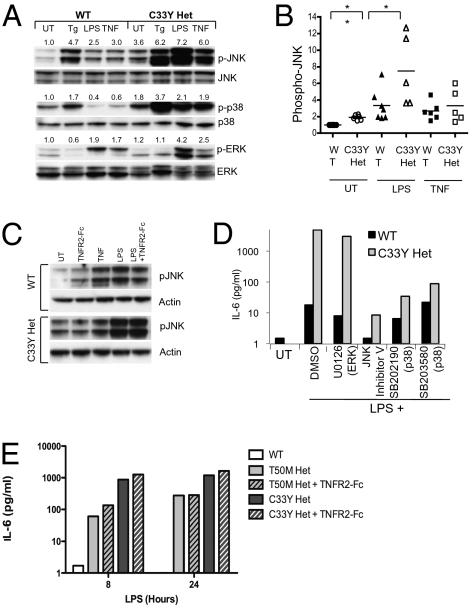
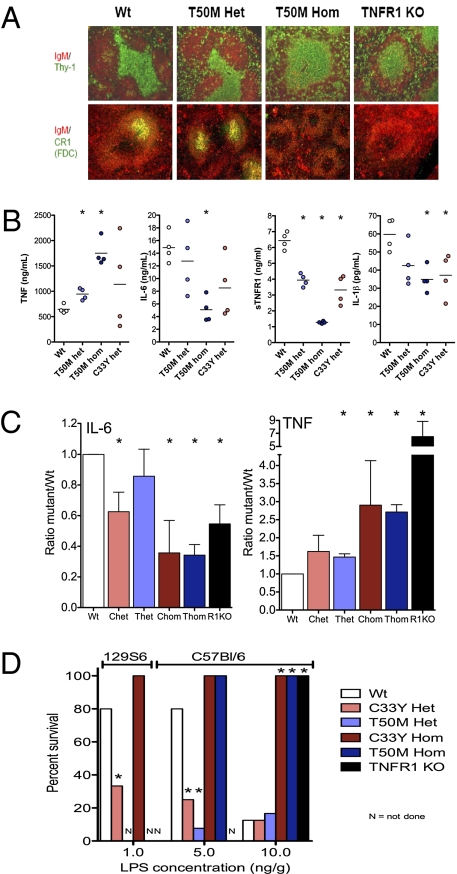
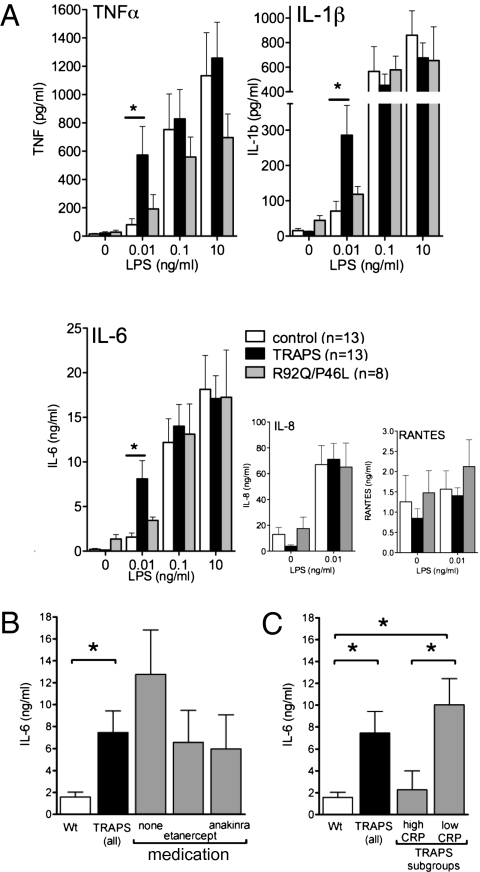
TNF, acting through p55 tumor necrosis factor receptor 1 (TNFR1), contributes to the pathogenesis of many inflammatory diseases. TNFR-associated periodic syndrome (TRAPS, OMIM 142680) is an autosomal dominant autoinflammatory disorder characterized by prolonged attacks of fevers, peritonitis, and soft tissue inflammation. TRAPS is caused by missense mutations in the extracellular domain of TNFR1 that affect receptor folding and trafficking. These mutations lead to loss of normal function rather than gain of function, and thus the pathogenesis of TRAPS is an enigma. Here we show that mutant TNFR1 accumulates intracellularly in peripheral blood mononuclear cells of TRAPS patients and in multiple cell types from two independent lines of knockin mice harboring TRAPS-associated TNFR1 mutations. Mutant TNFR1 did not function as a surface receptor for TNF but rather enhanced activation of MAPKs and secretion of proinflammatory cytokines upon stimulation with LPS. Enhanced inflammation depended on autocrine TNF secretion and WT TNFR1 in mouse and human myeloid cells but not in fibroblasts. Heterozygous TNFR1-mutant mice were hypersensitive to LPS-induced septic shock, whereas homozygous TNFR1-mutant mice resembled TNFR1-deficient mice and were resistant to septic shock. Thus WT and mutant TNFR1 act in concert from distinct cellular locations to potentiate inflammation in TRAPS. These findings establish a mechanism of pathogenesis in autosomal dominant diseases where full expression of the disease phenotype depends on functional cooperation between WT and mutant proteins and also may explain partial responses of TRAPS patients to TNF blockade.


Conflict of interest statement

The authors declare no conflict of interest.

Figures

Fig. 1.
Fig. 1.
Intracellular accumulation of TNFR1 protein in TRAPS. (A) Western blots of TNFR1 in cell lysates from the indicated cell types or organs from TRAPS-knockin mice harboring the indicated heterozygous (Het) or homozygous (Hom) TNFR1 mutations. WT C57BL/6 or TNFR1 knockout (KO) mice were used as controls. (B) Increased stability of TNFR1 protein in TRAPS MEF. Cells were treated with 10 μg/mL of cycloheximide for the indicated times, and TNFR1 levels were analyzed by Western blot. (C) Quantitation of Western blots of intracellular TNFR1 in PBMC from TRAPS patients with structural TNFR1 mutations (n = 23), from patients with R92Q or P46L functional polymorphisms (n = 10), and from healthy donor controls (WT; n = 9). Fold increase was calculated by dividing the density of TNFR1 bands from the patient relative to the average of control samples run on the same gel, after correction for loading with actin or HSC70. TNFR1 levels were significantly higher in TRAPS patients than in controls (P = 0.005, by unpaired two-tail Student's t test), whereas TNFR1 levels from patients with functional polymorphisms were not significantly different from controls. Inset shows an example of the primary Western blot data for three patients heterozygous for the indicated TNFR1 mutations and two healthy donor controls. (D) Resident peritoneal macrophages from mice of the indicated genotype were stimulated with 100 ng/mL murine TNF. IL-6, and MIP-2 were measured after 6 h. The data are averages ± SEM of at least three independent experiments, each with values normalized to the secretion of cytokines by WT cells in each experiment. IL-6 and MIP-2 levels produced by WT macrophages ranged from 933–3,367 pg/mL and 5,957–47,519 pg/mL, respectively. *, comparisons with WT cells with P < 0.05 by unpaired Student's t test.
Fig. 2.
Fig. 2.
Enhanced IL-6 production dependent on JNK and p38 kinases in TNFR1-mutant MEF. (A) WT and C33Y heterozygous TNFR1-mutant MEF were left untreated (UT) or were treated with thapsigargin (Tg; 10 μM), LPS (100 ng/mL), or murine TNF (100 ng/mL) for 1 h. Total cell extracts were prepared and subjected to Western blot analysis to detect the levels of the indicated proteins. Numbers shown are the density of each phosphoprotein relative to nonphosphorylated protein normalized to the WT untreated sample. (B) Quantitation of the data in A for pJNK from at least five independent experiments with LPS and TNF. pJNK was calculated from the ratio of density of pJNK/JNK in each sample, and the average of untreated WT MEF was normalized to 1 for each experiment. **, P = 0.0024; *, P = 0.038 for the indicated comparisons (Student's unpaired t test). (C) JNK hyperphosphorylation is independent of TNF in TNFR1-mutant MEF. Cells of the indicated genotype were treated with the indicated agents as in A with or without 10 μg/mL TNFR2-Fc (etanercept) previously added to the cultures. (D) WT and C33Y TNFR1 heterozygous mutant MEF were pretreated for 30 min with DMSO or with 5 μM ERK inhibitor U0126, 10 μM JNK II inhibitor, 10 μM p38 inhibitor SB202190, or 10 μM p38 inhibitor SB203580 and then were stimulated with 100 ng/mL LPS for 6 h before collection of supernatants for IL-6 measurement. MTT assays confirmed lack of toxicity of these inhibitors under identical conditions. (E) WT and T50M and C33Y TNFR1 heterozygous mutant MEF were plated at 5 × 10⁵ cells/well and left untreated or incubated with 100 ng/mL LPS for 8 h with or without 10 μg/mL TNFR2-Fc. IL-6 in supernatants was measured by cytokine bead assay. Data are averages ± SEM of three to five independent experiments.
Fig. 3.
Fig. 3.
Phenotype and altered responsiveness to LPS in knockin mice harboring TRAPS-associated TNFR1 mutations. (A) Immunofluorescence images of the indicated markers in spleens from mice with targeted TNFR1 mutations, performed as previously described (38). Note the lack of well-defined T-cell zones or complement receptor 1 (CR1)-positive follicular dendritic cells in T50M TNFR1 homozygous mutant mice. (B) Serum cytokine concentrations 2 h after i.p. injection with 50 ng/g LPS in mice that were either WT (Wt), heterozygous for T50M mutation (T50M Het), homozygous for T50M mutation (T50M Hom), or heterozygous for the TNFR1 T50MC33Y mutation (C33Y Het). (C) Summary of serum concentrations of IL-6 and TNF 2 h after i.p. LPS injection from seven independent experiments performed as described in B. Ratios are normalized to the average of each cytokine detected in each experiment ± SEM. *, P < 0.05 from t test comparisons vs. WT mice. Chet, heterozygous C33Y; Chom, homozygous C33Y; R1KO, homozygous knockout for TNFR1; Thet, heterozygous T50M; Thom, homozygous T50M. (D) Summary of three independent lethality studies, with survival of mice of the indicated genotype (either 129S6 background or C57BL/6 background) after i.p. injection of the indicated doses of LPS and D-galactosamine. *, P < 0.05 from t test comparisons vs. WT mice.
Fig. 4.
Fig. 4.
PBMC from TRAPS patients are hyperresponsive to low-dose LPS. (A) PBMC from patients with TRAPS heterozygous for structural TNFR1 mutations (n = 13, black bars), R92Q or P46L functional polymorphisms (n = 8, gray bars), or healthy controls (n = 13, white bars) were stimulated with the indicated dose of LPS for 24 h, and cytokine concentrations in supernatants were measured by cytometric bead array. P values obtained for differences vs. controls for samples from patients with structural TNFR1 mutations at 0.01 ng/mL LPS were 0.038 for TNF; 0.034 for IL-1β; and 0.011 for IL-6 (Student's unpaired t test). (B) Data from A were reanalyzed in subsets of patients treated with the indicated biologic agents. (C) Data from A were reanalyzed for patients having low (<2 mg/dL) or high (>2 mg/dL) CRP at the time of sample collection. *, P < 0.05 for the indicated comparisons.

Comment in

Similar articles

Cited by

References

    1. Micheau O, Tschopp J. Induction of TNF receptor I-mediated apoptosis via two sequential signaling complexes. Cell. 2003;114:181–190. - PubMed
    1. Chen G, Goeddel DV. TNF-R1 signaling: A beautiful pathway. Science. 2002;296:1634–1635. - PubMed
    1. McDermott MF, et al. Germline mutations in the extracellular domains of the 55 kDa TNF receptor, TNFR1, define a family of dominantly inherited autoinflammatory syndromes. Cell. 1999;97:133–144. - PubMed
    1. Kimberley FC, Lobito AA, Siegel RM, Screaton GR. Falling into TRAPS - receptor misfolding in the TNF receptor 1-associated periodic fever syndrome. Arthritis Res Ther. 2007;9:217. - PMC - PubMed
    1. Martinon F, Petrilli V, Mayor A, Tardivel A, Tschopp J. Gout-associated uric acid crystals activate the NALP3 inflammasome. Nature. 2006;440:237–241. - PubMed

Publication types

MeSH terms

Substances