. 2010 May 25;107(21):9695-700.
doi: 10.1073/pnas.0912886107. Epub 2010 May 10.

Enzootic and epizootic dynamics of the chytrid fungal pathogen of amphibians

Affiliations

Enzootic and epizootic dynamics of the chytrid fungal pathogen of amphibians

Cheryl J Briggs et al. Proc Natl Acad Sci U S A. .

Abstract

Chytridiomycosis, the disease caused by the chytrid fungus, Batrachochytrium dendrobatidis (Bd), has contributed to amphibian population declines and extinctions worldwide. The impact of this pathogen, however, varies markedly among amphibian species and populations. Following invasion into some areas of California's Sierra Nevada, Bd leads to rapid declines and local extinctions of frog populations (Rana muscosa, R. sierrae). In other areas, infected populations of the same frog species have declined but persisted at low host densities for many years. We present results of a 5-year study showing that infected adult frogs in persistent populations have low fungal loads, are surviving between years, and frequently lose and regain the infection. Here we put forward the hypothesis that fungal load dynamics can explain the different population-level outcomes of Bd observed in different areas of the Sierra Nevada and possibly throughout the world. We develop a model that incorporates the biological details of the Bd-host interaction. Importantly, model results suggest that host persistence versus extinction does not require differences in host susceptibility, pathogen virulence, or environmental conditions, and may be just epidemic and endemic population dynamics of the same host-pathogen system. The different disease outcomes seen in natural populations may result solely from density-dependent host-pathogen dynamics. The model also shows that persistence of Bd is enhanced by the long-lived tadpole stage that characterize these two frog species, and by nonhost Bd reservoirs.


Conflict of interest statement

The authors declare no conflict of interest.

Figures

Fig. 1.
Fig. 1.
Bd load data from R. sierrae at sites with enzootic infections. (A–C) Infection prevalence and distribution of Bd loads in adult R. sierrae at three sites over 5 years. The number of individuals swabbed is shown at the top of each bar. The distribution of Bd load, as measured by the numbers of zoospores per swab (Zswab) as estimated by real-time PCR is shown in the colored bars. (D) Comparison of the fungal load in young tadpoles (Gosner stage ≤ 37), old tadpoles (Gosner stage 38–41), metamorphs, and adults at the three sites for all dates combined. Bd loads on subadults (postmetamorphic individuals with a snout-to-vent length of 35–40 mm) was not significantly different from those on adult frogs, and subadults and adults are combined in the figure. (E) Examples of changes in Bd load through time for individually marked adult R. sierrae. Shown are Bd loads for six of the individuals at site 3 that were captured in multiple years.
Fig. 2.
Fig. 2.
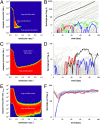
The Bd load model, and results from the deterministic version within a year. (A) Diagram of the within-host/zoospore pool model. (B) Growth rate of Bd on individual frogs (λ), as a function of f, the fraction of zoospores that reencounter the host from which they were released, and ν, the fraction of zoospores that successfully infect the frog skin on encountering a host. Other parameters are V = 1 unit volume, γ = 0.01 unit volume · day−1, μ = 1 day−1, η = 17.5 zoospores · day−1, and σ = 0.2 day−1. (C) Growth rate, λ, of Bd in the zoospore pool and time to reach Smax = 10,000 sporangia as a function of frog density. Parameters are as in B, with ν = 0.05 and f = 0.05. With few frogs present, the growth of Bd on each frog is negative, and all frogs will clear the infection. Above a density of ~20 frogs, the Bd growth rate is positive on each frog. Also shown is the number of days that it takes for the density of sporangia on each frog to reach Smax.
Fig. 3.
Fig. 3.
Probability of persistence, and sample within-season trajectories for three different variants of the stochastic model. (A, C, and E) Probability of frogs and Bd persisting for at least 10 years as a function of reinfection rate, f, and zoospore encounter rate, γ. Shown are the fractions of 100 runs for each combination of parameters that persist for at least 10 years (red, 100% of runs persist; blue, 0% of runs persist). All runs are initialized with a single infected frog in an otherwise uninfected frog population at its carrying capacity and no zoospores in the zoospore pool (Z = 0). In all of the models, the frog population can be rapidly driven extinct at high values of the zoospore encounter rate (high γ). (B, D, and F) Examples of within-season dynamics showing the dynamics of the number of sporangia on individual frogs. The colored lines are highlighted examples of trajectories of sporangia on individual frogs. (A and B) Unstructured host model, with R = 4, K = 100 frogs, θF = 0.9, θZ = 0.1, V = 1 unit volume, ν = 0.1, μ = 1 day−1, η = 17.5 zoospores · day−1, and σ = 0.2 day−1. In B, f = 0.15, γ = 1 × 10⁻⁶ unit volume · day−1. (C and D) Model with external source of zoospores. All parameters are as in A, with εZ = 1,000 zoospores. In D, f = 0.1, γ = 1 × 10⁻⁴ unit volume · day−1. (E and F) Model with long-lived tadpole stage. In F, f = 0.05 for both tadpoles and adults, γadult = 1 × 10⁻⁶ unit volume · day−1, γtadpole = 100 · γadult, νadult = νtadpole = 0.1, Smax_adult = Smax_tadpole = 10,000 sporangia, R = 40 tadpoles, θadult = 0.9, θtadpole = 0.2, θZ = 0.1, m = 0.5, V = 1 unit volume, γ = 0.01 unit volume · day−1, μ = 1 day−1, η = 17.5 zoospores · day−1, and σ = 0.2 day−1. Stars in A, C, and E indicate parameter values used for simulations in B, D, and F, respectively.
Fig. 4.
Fig. 4.
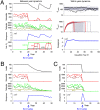
Examples of dynamics of model with full-stage R. muscosa/R. sierra structure. The simulation starts with the population uninfected, and Bd invades during year 20 of the simulation. For A, the within-season dynamics are also shown for a single year (year 51). Thick lines in the within-season dynamics plots are simply trajectories of highlighted individuals for illustrative purposes. In A, γadult = 1 × 10⁻⁶ unit volume · day−1, γsubadult = 10 · γadult, γtadpole = 100 · γadult, Smax_adult = 10,000, Smax_subadult = Smax_tadpole = 1,000. In B. γadult = 1 × 10⁻⁴ unit volume · day−1, γsubadult =10 · γadult, γtadpole = 100 · γadult, Smax_adult = 10,000, and Smax_subadult = Smax_tadpole = 1,000. In C, γadult = γsubadult = γtadpole =1 × 10⁻³ unit volume · day−1, Smax_adult = Smax_subadult = Smax_tadpole = 10,000, θadult = 0.9, θsub1 = θsub2 = 0.7, θtad1 = θtad2 = θtad3 = 0.7, θZ = 0.5, m = 0.5, ωmetamorph = 0.9, pF = 0.25, R = 100, K = 100, f = 0.1, ν = 0.1, η = 17.5 zoospores · day−1, σ = 0.2 day−1 for all frog stages, V = 1 unit volume, and μ = 1 day−1.

Comment in

  • It’s not easy being green.
    Jermy A. Jermy A. Nat Rev Microbiol. 2010 Jul;8(7):467. doi: 10.1038/nrmicro2388. Nat Rev Microbiol. 2010. PMID: 21394962 No abstract available.

Similar articles

Cited by

References

    1. Gascon C, et al., editors. Gland, Switzerland: World Conservation Union; 2007. Amphibian Conservation Action Plan. Proceedings of the IUCN.SSC Amphibian Conservation Summit 2005. Available at http://intranet.iucn.org/webfiles/doc/SSC/SSCwebsite/GAA/ACAP_Summit_Dec.... Accessed November 1, 2009.
    1. Berger L, et al. Chytridiomycosis causes amphibian mortality associated with population declines in the rain forests of Australia and Central America. Proc Natl Acad Sci USA. 1998;95:9031–9036. - PMC - PubMed
    1. Longcore JE, Pessier AP, Nichols DK. Batrachochytrium dendrobatidis gen. et sp. nov., a chytrid pathogenic to amphibians. Mycologia. 1999;91:219–227.
    1. Rachowicz LJ, et al. The novel and endemic pathogen hypotheses: Competing explanations for the origin of emerging infectious diseases of wildlife. Conserv Biol. 2005;19:1441–1448.
    1. Skerratt LF, et al. Spread of chytridiomycosis has caused the rapid global decline and extinction of frogs. EcoHealth. 2007;4:125–134.

Publication types