Comparative Study
. 2010 May;128(5):560-8.
doi: 10.1001/archophthalmol.2010.52.

Glaucomatous progression in series of stereoscopic photographs and Heidelberg retina tomograph images

Affiliations
Comparative Study

Glaucomatous progression in series of stereoscopic photographs and Heidelberg retina tomograph images

Neil O'Leary et al. Arch Ophthalmol. 2010 May.

Abstract

Objective: To compare optic disc changes using automated analysis of Heidelberg retina tomograph (HRT) images with assessments, by glaucoma specialists, of change in stereoscopic photographs.

Methods: Baseline and follow-up stereophotographs and corresponding HRT I series of 91 eyes from 56 patients were selected. The selection criteria were sufficiently long, good-quality HRT series (7 visits in > or =70 months of follow-up) and follow-up photographs contemporaneous with the final HRT image. Topographic change analysis (TCA), statistic image mapping (SIM), and linear regression of rim area (RALR) across time were applied to HRT series. Glaucomatous change determined from stereophotographs by expert observers was used as the reference standard.

Results: Expert observers identified 33 eyes (36%) as exhibiting glaucomatous change. Altering HRT progression criteria such that 36% of eyes progressed according to each method resulted in concordance between HRT methods and stereophotograph assessment of 54% for TCA, 65% for SIM, and 67% for RALR (Cohen kappa = 0.05, 0.23, and 0.30, respectively). Receiver operating characteristic curves of the HRT analyses revealed poor precision of HRT analyses to predict stereophotograph-assessed change: areas under the curve were 0.61 for TCA, 0.62 for SIM, and 0.66 for RALR.

Conclusions: Statistical methods for detecting structural changes in HRT images exhibit only moderate agreement with each other and have poor agreement with expert-assessed change in optic disc stereophotographs.


Figures
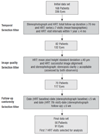
Figure 1
Figure 1
Selection criteria applied and the resulting sample sizes (patients and eyes) at each stage of selection. HRT indicates Heidelberg retina tomography.
Figure 2
Figure 2
Receiver operating characteristic curves for Heidelberg retina tomograph progression algorithms using stereophotograph-assessed glaucomatous change as the reference standard for topographic change analysis (TCA), statistic image mapping (SIM), and ordinary least squares linear regression of rim area (RALR). Areas under the curve are 0.62 for SIM, 0.61 for TCA, and 0.66 for RALR.
Figure 3
Figure 3
Area proportional Venn diagrams representing the agreement of topographic change analysis (TCA) (A), statistic image mapping (SIM) (B), and ordinary least squares linear regression of rim area (RALR) (C) with stereophotograph assessment. Equal rates of identified progression mean that the circles in each diagram are equal in area.
Figure 4
Figure 4
Area proportional Venn diagrams representing the agreement of topographic change analysis (TCA), statistic image mapping (SIM), and ordinary least squares linear regression of rim area (RALR) with each other in determining glaucomatous progression. Equal rates of identified progression mean that the circles are equal in area.
Figure 5
Figure 5
Case 1. Single baseline (April 1998) (A) and single final follow-up (April 2005) (D) photographs from stereophotograph pairs, with excavation and rim narrowing indicated superotemporally and superonasally (arrows). B, Baseline Heidelberg retina tomograph (HRT) mean image (April 1998). Final follow-up HRT mean images (April 2005) with topographic change analysis (progression flagged) (C) and statistic image mapping (progression flagged) (E) output (the dark red pixels are the largest cluster of pixels in the disc). F, Output for linear regression of rim area (red sectors: significant P values for negative trend of rim area).
Figure 6
Figure 6
Case 2. Single baseline (August 1998) (A) and single final follow-up (August 2005) (D) photographs from stereophotograph pairs, with excavation indicated inferotemporally (arrow). B, Baseline Heidelberg retina tomograph (HRT) mean image (August 1998). Final follow-up HRT mean images (August 2005) with topographic change analysis (no progression flagged) (C) and statistic image mapping (no progression flagged) (E) output (the dark red pixels are the largest cluster of pixels in the disc). F, Output for linear regression of rim area (red sector: significant P value for negative trend of rim area).
Figure 7
Figure 7
Case 3. Single baseline (October 1998) (A) and single final follow-up (August 2005) (D) photographs from stereophotograph pairs, with excavation indicated inferotemporally (arrow). B, Baseline Heidelberg retina tomograph (HRT) mean image (October 1998). Final follow-up HRT mean images (August 2005) with topographic change analysis (no progression flagged) (C) and statistic image mapping (no progression flagged) (E) output (the dark red pixels are the largest cluster of pixels in the disc). F, Output for linear regression of rim area (green center: no significant P values for negative trend of rim area).
Figure 8
Figure 8
Case 4. Single baseline (July 1998) (A) and single final follow-up (July 2005) (D) photographs from stereophotograph pairs, with no observed change. B, Baseline Heidelberg retina tomograph (HRT) mean image (July 1998). Final follow-up HRT mean images (July 2005) with topographic change analysis (progression flagged) (C) and statistic image mapping (progression flagged) (E) output (the dark red pixels are the largest cluster of pixels in the disc). F, Output for linear regression of rim area (red sector: significant P value for negative trend of rim area).

References

    1. Chauhan BC. Confocal scanning laser tomography. Can J Ophthalmol. 1996;31(3):152–156.
    1. Zinser GR, Wijnaendts-van-Resandt RW, Dreher AW, Weinreb RW, Harbarth U, Burk ROW. Confocal laser tomographic scanning of the eye. Proc SPIE. 1989;(1161):337–344.
    1. Wollstein G, Garway-Heath DF, Hitchings RA. Identification of early glaucoma cases with the scanning laser ophthalmoscope. Ophthalmology. 1998;105(8):1557–1563. - PubMed
    1. Mikelberg FS, Parfitt CM, Swindale NV, Graham SL, Drance SM, Gosine R. Ability of the Heidelberg retinal tomograph to detect early glaucomatous visual field loss. J Glaucoma. 1995;4(4):242–247. - PubMed
    1. Bathija R, Zangwill L, Berry CC, Sample PA, Weinreb RN. Detection of early glaucomatous structural damage with confocal scanning laser tomography. J Glaucoma. 1998;7(2):121–127. - PubMed

Publication types

MeSH terms