. 2010 Jun;120(6):2230-42.
doi: 10.1172/JCI37646. Epub 2010 May 10.

Rapid T cell-based identification of human tumor tissue antigens by automated two-dimensional protein fractionation

Affiliations

Rapid T cell-based identification of human tumor tissue antigens by automated two-dimensional protein fractionation

Philipp Beckhove et al. J Clin Invest. 2010 Jun.

Abstract

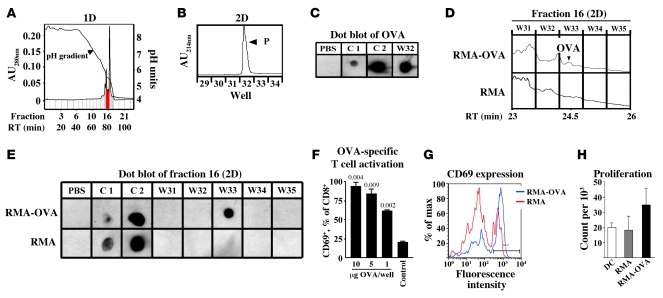
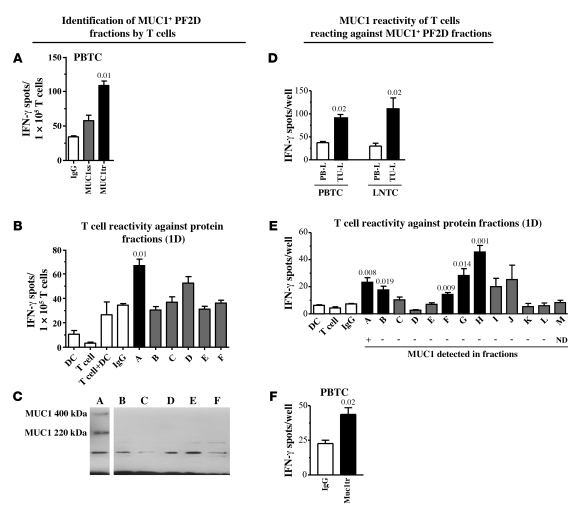
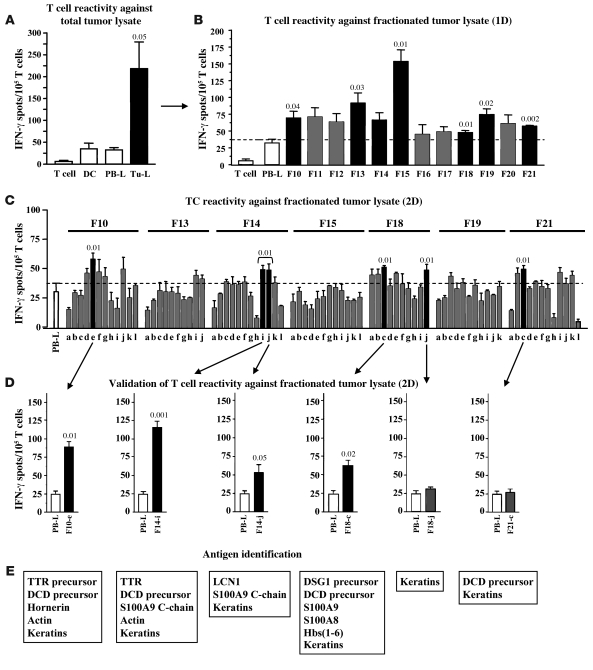
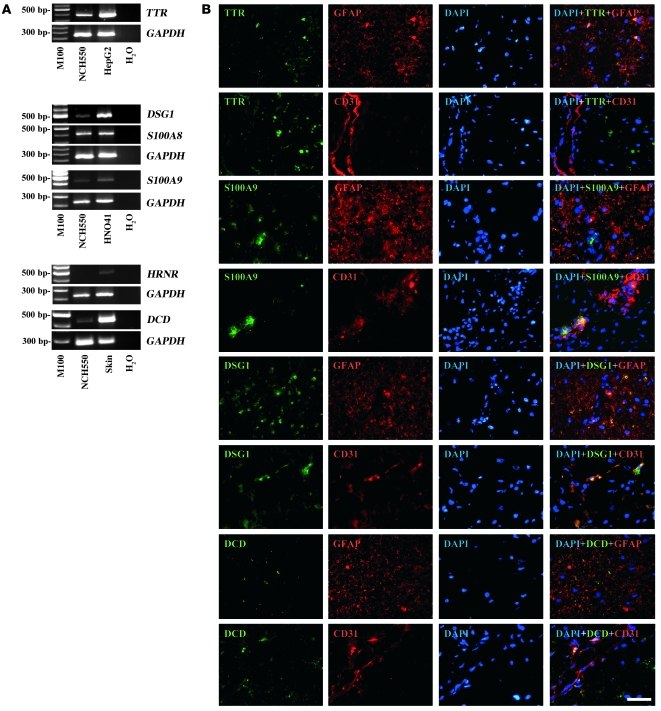
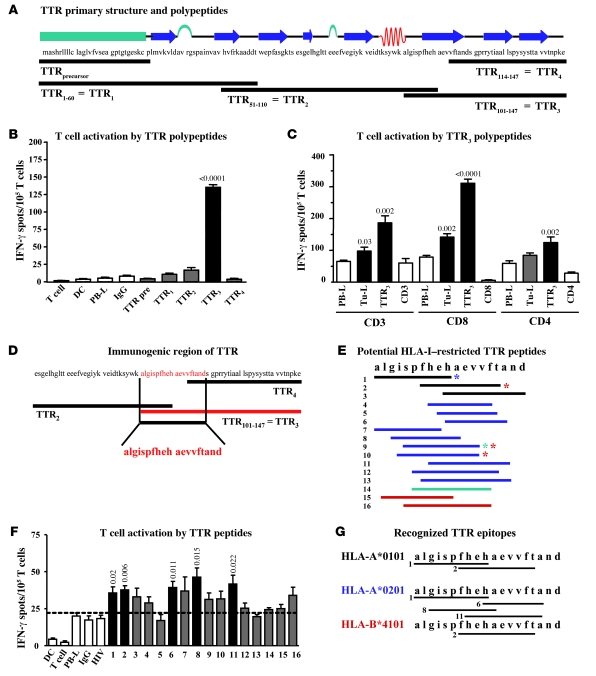
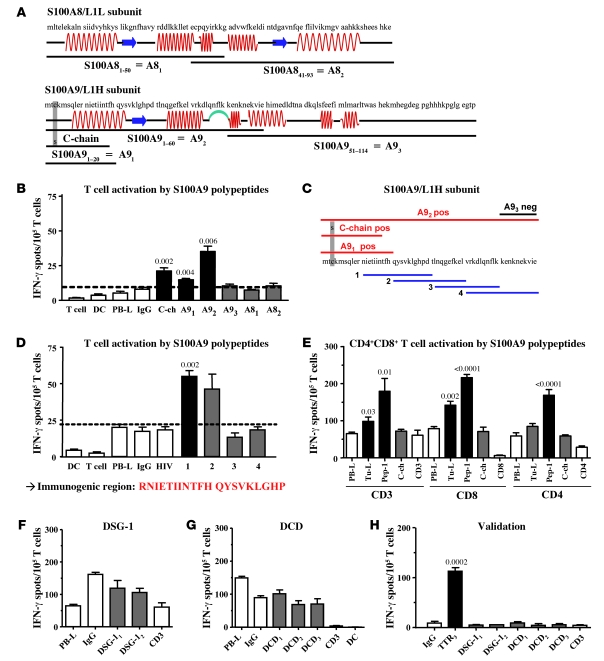
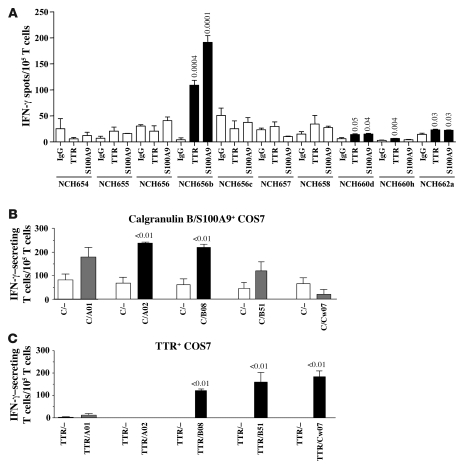
Identifying the antigens that have the potential to trigger endogenous antitumor responses in an individual cancer patient is likely to enhance the efficacy of cancer immunotherapy, but current methodologies do not efficiently identify such antigens. This study describes what we believe to be a new method of comprehensively identifying candidate tissue antigens that spontaneously cause T cell responses in disease situations. We used the newly developed automated, two-dimensional chromatography system PF2D to fractionate the proteome of human tumor tissues and tested protein fractions for recognition by preexisting tumor-specific CD4+ Th cells and CTLs. Applying this method using mice transgenic for a TCR that recognizes an OVA peptide presented by MHC class I, we demonstrated efficient separation, processing, and cross-presentation to CD8+ T cells by DCs of OVA expressed by the OVA-transfected mouse lymphoma RMA-OVA. Applying this method to human tumor tissues, we identified MUC1 and EGFR as tumor-associated antigens selectively recognized by T cells in patients with head and neck cancer. Finally, in an exemplary patient with a malignant brain tumor, we detected CD4+ and CD8+ T cell responses against two novel antigens, transthyretin and calgranulin B/S100A9, which were expressed in tumor and endothelial cells. The immunogenicity of these antigens was confirmed in 4 of 10 other brain tumor patients. This fast and inexpensive method therefore appears suitable for identifying candidate T cell antigens in various disease situations, such as autoimmune and malignant diseases, without being restricted to expression by a certain cell type or HLA allele.


Figures

Figure 1
Figure 1. Fractionation, detection, and cross-presentation of recombinant OVA and OVA from OVA-overexpressing cells.
(A) 1D profile of 1 mg OVA. Red area corresponds to fraction 16. (B) 2D profile of fraction 16 of recombinant OVA. Main peak (P) was eluted in W32. AU, absorbance units. (C) Confirmation of OVA protein in W32. (D) Differential expression map of 2D separation of fraction 16 of RMA-OVA and RMA cells. Among others, a peak at RT = 24.4 minutes was detected in RMA-OVA but not RMA fraction and eluted to W33. (E) Confirmation of OVA protein in W33 of RMA-OVA cells only. (C and E) PBS served as negative and recombinant OVA as positive control (C1, 0.5 ng; C2, 5 ng). (F) DCs from C57BL/6 mice pulsed with fractionated recombinant OVA (W32, B) were used to stimulate OVA-specific T cells. T cells stained with CD8- and CD69-PE to evaluate the proportion of early-activated T cells by flow cytometry showed dose-dependent OVA-specific T cell activation. (G and H) DCs pulsed with proteins derived from OVA-positive 2D fraction of RMA-OVA or respective fraction from RMA cells (W33; E). (G) T cell activation as determined by flow cytometry with anti-CD69 antibodies. In F and G, one representative experiment of 3 independent experiments is shown. (H) Proliferative activity of purified CD8+ OVA-specific T cells after activation with DCs loaded with fractions W33 from RMA-OVA or RMA cells or after activation with unpulsed DCs as determined by thymidine incorporation. Mean + SD of 2 independent experiments is shown.
Figure 2
Figure 2. Identification of MUC1+ protein fractions by MUC1-reactive T cells from patients with head and neck cancer.
(A) T cell reactivity of patient HN-1 against DCs pulsed with synthetic, MUC1-derived long peptides from the signaling sequence (MUC1ss) or the tandem repeat region (MUC1tr) as revealed by IFN-γ ELISPOT assay. (B) T cell reactivity of HN-1 against DCs pulsed with 1D fraction A but not B–F of the patient’s autologous tumor. (C) Detection of MUC1 protein in PF2D fraction A by IP. Lanes were run on the same gel but were noncontiguous, as indicated by the black line. (D) T cell reactivity of patient HN-2 against TU-L–pulsed DCs as revealed by IFN-γ ELISPOT assay. (E) T cell reactivity of HN-2 against DCs pulsed with 1D fractions (A–M) of the patient’s autologous tumor. Corresponding results of MUC1 protein detection by MUC1-specific IP are indicated for each PF2D fraction below (+, MUC1-positive; –, no detection of MUC1; ND, not determined). MUC1 could only be detected in fraction A. (F) T cell reactivity of patient HN-2 against DCs pulsed with synthetic, MUC1-derived long peptide (tandem repeat region, MUC1tr) as revealed by IFN-γ ELISPOT assay. Negative controls are denoted by white bars; statistically significant differences versus IgG or PBMC lysate (PB-L) control, as appropriate, are indicated by black bars; gray bars indicate nonsignificant responses. PBTC, peripheral blood–derived T cells; LNTC, tumor-draining lymph node–derived T cells.
Figure 3
Figure 3. Recognition of autologous tumor protein fractions by T cells from NCH550 and identification of candidate target antigens.
(A) DCs from brain tumor patient NCH550 pulsed with tumor cell lysate (TU-L) or autologous PB-L as negative control were used to stimulate blood-derived T cells from the same patient in IFN-γ ELISPOT assay. Additionally, purified TU-L–pulsed DCs or unstimulated PB-derived T cells served as controls. PBTCs of NCH550 reacted significantly against autologous tumor-derived antigens as compared with negative control antigens derived from autologous PB-L. (B) T cell reactivity of NCH550 against 1D separated protein fractions (F10–F21) as revealed by IFN-γ ELISPOT assay. (C) 1D fractions recognized by patient’s T cells (F10, F13–15, F18, F19, F21) subjected to 2D separation. Obtained subfractions were tested for recognition by autologous T cells in IFN-γ ELISPOT assay. (D) For validation, whole tumor lysate was subjected a second time to 2D PF2D protein separation, and subfractions recognized previously (Figure 1C; F10-e, F14-i, F14-j, F18-c, F18-j, F21-c) were tested again for recognition by autologous T cells. The experiment confirmed T cell reactivity against subfractions F10-e, F14-i, F14-j, and F18-c. (E) Proteins present in recognized subfractions as identified by MS are shown, respectively. Negative controls are denoted by white bars; statistically significant differences versus PB-L control are indicated by black bars; gray bars indicate nonsignificant responses. Hbs, hemoglobins.
Figure 4
Figure 4. Expression of potentially immunogenic proteins in tumor tissue of patient NCH550.
(A) In the first step, expression of identified antigens was validated by RT-PCR. Total RNA was isolated from tumor tissue and respective positive controls: HepG2 cell line for TTR, HNO41 tonsil carcinoma for DSG-1, S100A8 and S100A9, and normal skin tissue for DCD and hornerin (HRNR). Expression of TTR, DSG1, calgranulin subunits S100A8 and S100A9, as well as DCD could be confirmed in the patient’s tumor tissue, while HRNR mRNA was only detected in the positive control. (B) TTR, calgranulin B/S100A9, DSG-1, and DCD were further tested for protein expression by double immunofluorescence staining in order to identify their cellular distribution pattern in the patient’s tumor tissue. Tumor cells were labeled with anti-GFAP antibodies, endothelial cells with anti-CD31 antibodies, and nuclei with DAPI. While TTR protein was found solely in a subpopulation of GFAP-positive tumor cells, calgranulin B/S100A9 and DSG-1 were detected on both endothelial cells and on a few tumor cells. In contrast, DCD expression was predominantly seen on CD31-postive endothelial cells rather than on tumor cells. Scale bar: 50 μm.
Figure 5
Figure 5. TTR as target antigen of autologous T cells from NCH550.
(A) Molecular structure and amino acid sequence (AAS) of TTR and TTR precursor (protein ID NP_000362). Black lines indicate synthetic polypeptides used for T cell stimulation. (B) Recognition of synthetic polypeptides by NCH550 T cells in IFN-γ ELISPOT assay. Autologous PB-L, human IgG, T cells, and DCs served as negative controls. DCs pulsed by TTR3 resulted in significantly increased IFN-γ spot numbers. (C) Significant reactivity of total CD3, CD8+, and CD4+ T cells against DCs pulsed with either total autologous tumor lysate or with synthetic TTR3 as compared with PB-L control. (D) AAS of the immunogenic region of TTR as revealed by IFN-γ ELISPOT assays using synthetic polypeptides. (E) AAS of predicted epitopes potentially presented by different HLA-I molecules of NCH550 (HLA-A*0101–restricted epitopes, black; HLA-A*0201–restricted epitopes, blue; HLA-B*4101, red; HLA-B*5101, green). Colored asterisks indicate epitopes that may be also presented by other HLA-I molecules. (F) Recognition of HLA-I–restricted peptides (E). DCs pulsed with autologous PB-L, human IgG, and HLA-A0201–restricted peptide from HIVgag served as negative control antigens. White bars indicate unstimulated or PB-L–stimulated subpopulations of CD3+, CD8+, or CD4+ T cells; black bars show significantly increased IFN-γ spot numbers as compared with PB-L control; gray bars show nonsignificant T cell responses. (G) AAS of identified immunogenic target epitopes of TTR restricted to HLA-A*0101, HLA-A*0201, and HLA-B*4101 as recognized by T cells from patient NCH550 are indicated by black lines. Small indices correspond to peptide numbers as shown in E and F.
Figure 6
Figure 6. Calgranulin B/S100A9 but not DSG-1 or DCD is a target antigen of autologous T cells.
(A) Molecular structure and AAS of calgranulin B subunits S100A8 (protein ID NP_002955), S100A9 (protein ID NP_002956), and shorter variants (C-chain protein ID 1XK4_C). Black lines indicate AAS of synthetic polypeptides used for T cell stimulation. (B) Significant recognition of S100A9 C-chain (C-ch), peptide-1 (A91), and peptide-2 (A92) by NCH550 T cells as compared with IgG control. (C) Scheme and AAS of immunogenic region of S100A9 as revealed by IFN-γ ELISPOT assays using synthetic polypeptides (A and B). Red lines indicate significant recognition. Blue lines indicate AAS of overlapping 20-meric peptides used for further characterization of immunogenic epitopes. (D) Significant recognition of peptide-1 by NCH550 T cells as compared with PB-L control. AAS of immunogenic region is shown in red. (E) Significant reactivity of total CD3, CD8+, and CD4+ T cells against DCs pulsed with total autologous Tu-L or peptide-1 (Pep-1) as compared with PB-L control. White bars indicate unstimulated subpopulations of CD3+, CD8+, or CD4+ T cells. (FH) Reactivity of NCH550 T cells against DCs pulsed with synthetic polypeptides DSG61-100 and DSG211-245 (DSG-11 and DSG-12 respectively; protein-ID NP_001933) spanning 2 described immunogenic regions of DSG-1 (FH) or with DCD1-40, DCD31-70, and DCD61-110 (DCD1, DCD2, and DCD3, respectively) of DCD (protein ID NP_444513) (G and H) by NCH550 T cells. (H) Validation of negative results; polypeptide TTR3 served as positive control. Tests were performed in 3 independent experiments at 3 different time points (B, D, E, H).
Figure 7
Figure 7. TTR and calgranulin B/S100A9 are frequently recognized in patients with brain tumors and can be recognized by T cells on antigen-expressing tumor cells.
DCs from another 10 different brain tumor patients were pulsed with synthetic peptides derived from TTR101-147 (TTR) or calgranulin B/S100A91-60 (S100A9) as test antigens or with human IgG as control antigen at a concentration of 200 μg/ml and used for stimulation of blood-derived T cells from the same patients in triplicate wells in IFN-γ ELISPOT assays. (B and C) Response of T cells from NCH656b against calgranulin B and TTR expressed by COS7 tumor cells. COS7 cells were transfected with calgranulin B (A) or TTR (B) either alone (C/– or TTR/–, respectively), which served as negative controls (white bars), or together with respective HLA-I molecules expressed by NCH550 cells (test groups). Transfected COS7 cells were cocultured with T cells from NCH550, and T cell reactivity was evaluated by IFN-γ ELISPOT assay. IFN-γ spot numbers secreted by T cells were calculated by subtracting background spots derived from transfected COS7 cells alone. Black bars indicate significantly increased IFN-γ spot numbers as compared with HLA-deficient control; gray bars indicate nonsignificant T cell response; white bars indicate negative control group containing T cells cocultured with COS7 cells transfected with the respective tumor antigens but not with respective HLA-I molecules.

Similar articles

Cited by

References

    1. Lennerz V, et al. The response of autologous T cells to a human melanoma is dominated by mutated neoantigens. Proc Natl Acad Sci U S A. 2005;102(44):16013–16018. - PMC - PubMed
    1. Sommerfeldt N, Schutz F, Sohn C, Forster J, Schirrmacher V, Beckhove P. The shaping of a polyvalent and highly individual T-cell repertoire in the bone marrow of breast cancer patients. Cancer Res. 2006;66(16):8258–8265. doi: 10.1158/0008-5472.CAN-05-4201. - DOI - PubMed
    1. Weinschenk T, et al. Integrated functional genomics approach for the design of patient-individual antitumor vaccines. Cancer Res. 2002;62(20):5818–5827. - PubMed
    1. Celis E, et al. Identification of potential CTL epitopes of tumor-associated antigen MAGE-1 for five common HLA-A alleles. Mol Immunol. 1994;31(18):1423–1430. - PubMed
    1. Cox AL, et al. Identification of a peptide recognized by five melanoma-specific human cytotoxic T cell lines. Science. 1994;264(5159):716–719. doi: 10.1126/science.7513441. - DOI - PubMed

Publication types

MeSH terms