

Influence of calibration method on distortion-product otoacoustic emission measurements: I. test performance
- PMID: 20458246
- PMCID: PMC2896442
- DOI: 10.1097/AUD.0b013e3181d86b3d
Influence of calibration method on distortion-product otoacoustic emission measurements: I. test performance
Abstract
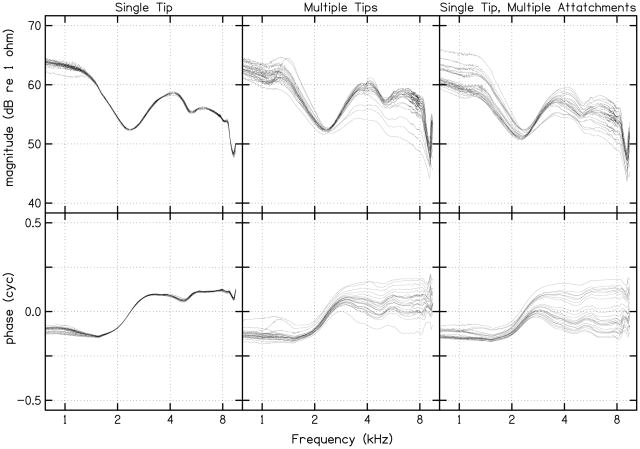
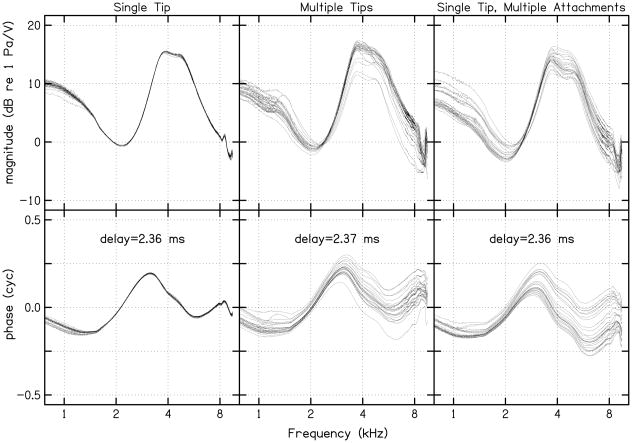
Objective: Calibration errors in distortion-product otoacoustic emission (DPOAE) measurements because of standing waves cause unpredictable changes in stimulus and DPOAE response level. The purpose of this study was to assess the extent to which these errors affect DPOAE test performance. Standard calibration procedures use sound pressure level (SPL) to determine specified levels. Forward pressure level (FPL) is an alternate calibration method that is less susceptible to standing waves. However, FPL derivation requires prior cavity measurements, which have associated variability. In an attempt to address this variability, four FPL methods were compared with SPL: a reference calibration derived from 25 measurements before all data collection and a daily calibration measurement, both of which were made at body and room temperature.
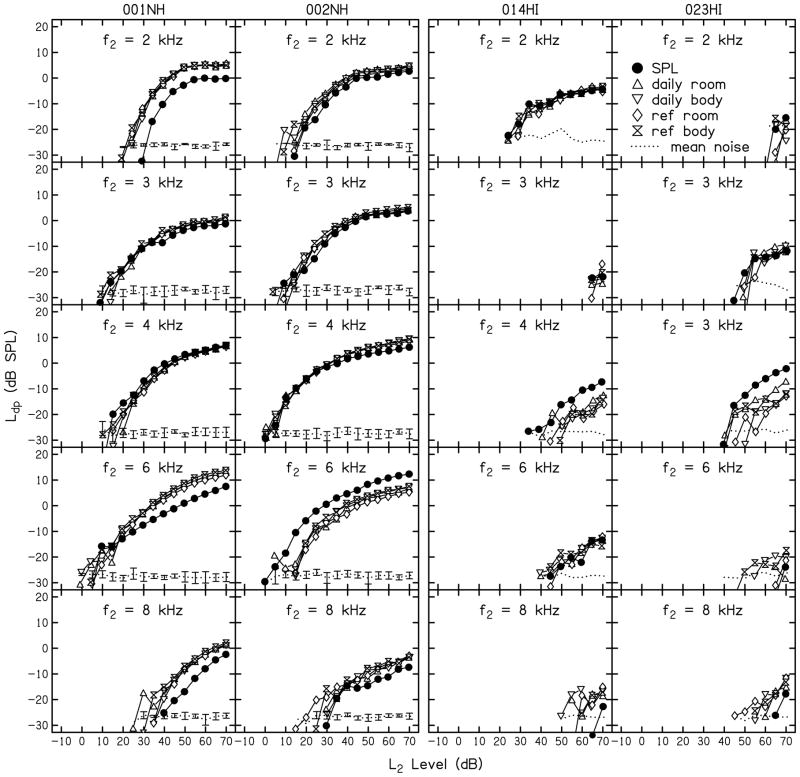
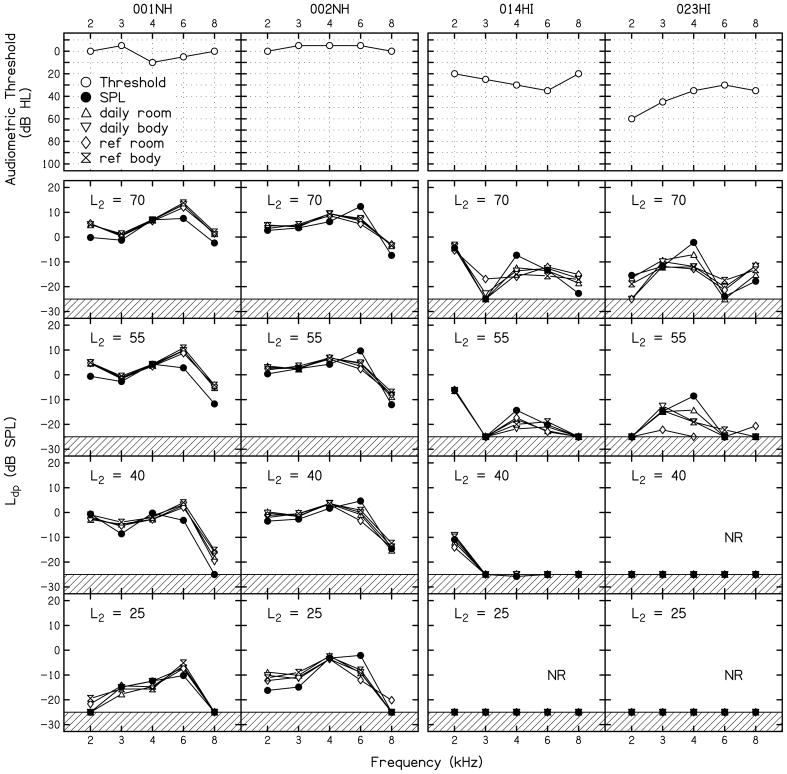
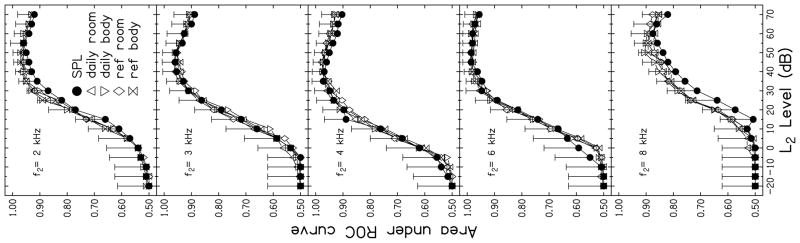
Design: Data were collected from 52 normal-hearing and 103 hearing-impaired subjects. DPOAEs were measured for f2 frequencies ranging from 2 to 8 kHz in half-octave steps, with L2 ranging from -20 to 70 dB SPL (5-dB steps). At each f2, DPOAEs were measured in five calibration conditions: SPL, daily FPL at body temperature (daily body), daily FPL at room temperature (daily room), reference FPL at body temperature (ref body), and reference FPL at room temperature (ref room). Data were used to construct receiver operating characteristic (ROC) curves for each f2, calibration method, and L2. From these curves, areas under the ROC curve (AROC) were estimated.
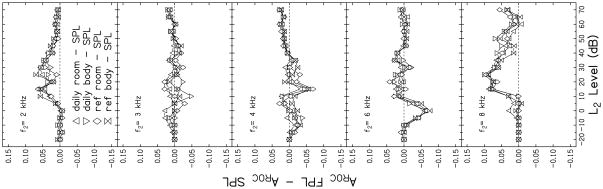
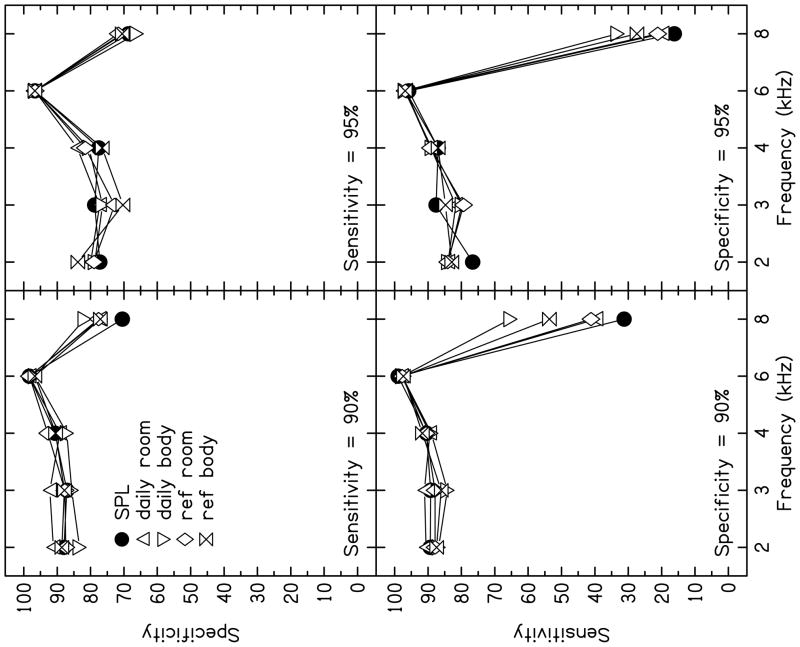
Results: The results of this study are summarized by the following observations: (1) DPOAE test performance was sensitive to stimulus level, regardless of calibration method, with the best test performance observed for moderate stimulus level conditions. (2) An effect of frequency was observed for all calibration methods, with the best test performance at 6 kHz and the worst performance at 8 kHz. (3) At clinically applicable stimulus levels, little difference in test performance among calibration methods was noted across frequencies, except at 8 kHz. At 8 kHz, FPL-based calibration methods provided superior performance compared with the standard SPL calibration. (4) A difference between FPL calibration methods was observed at 8 kHz, with the best test performance occurring for daily calibrations at body temperature.
Conclusions: With the exception of 8 kHz, there was little difference in test performance across calibration methods. At 8 kHz, AROCs and specificities for fixed sensitivities indicate that FPL-based calibration methods provide superior performance compared with the standard SPL calibration for clinically relevant levels. Temperature may have an impact on FPL calculations relative to DPOAE test performance. Although the differences in AROC among calibration procedures were not statistically significant, the present results indicate that standing wave errors may impact DPOAE test performance and can be reduced by using FPL, although the largest effects were restricted to 8 kHz.
Figures
References
-
- Allen JB. Measurement of eardrum acoustic impedance. In: Allen JB, Hall JL, Hubbard A, Neely ST, Tubis A, editors. Peripheral Auditory Mechanisms. Springer-Verlag; New York: 1986. pp. 44–51.
-
- ANSI. ANSI Report No. S3.6. American National Standards Institute; New York: 2004. Specifications for audiometers.
-
- Bamber D. The area above the ordinal dominance graph and the area below the receiver operating characteristic graph. J Math Pychol. 1975;12:387–415.
-
- Brown AM, Kemp DT. Suppressibility of the 2f1−f2 stimulated acoustic emissions in gerbil and man. Hear Res. 1984;13:29–37. - PubMed
-
- Brownell W. Observations on a motile response in isolated outer hair cells. In: Webster WR, Aitken L, editors. Mechanisms of Hearing. Montash University Press; Australia: 1983. pp. 5–10.
Publication types
MeSH terms
Grants and funding
LinkOut - more resources
Full Text Sources
Miscellaneous
