Comparative Study
. 2010 May;28(5):478-85.
doi: 10.1038/nbt.1623.

Kidney injury molecule-1 outperforms traditional biomarkers of kidney injury in preclinical biomarker qualification studies

Affiliations
Comparative Study

Kidney injury molecule-1 outperforms traditional biomarkers of kidney injury in preclinical biomarker qualification studies

Vishal S Vaidya et al. Nat Biotechnol. 2010 May.

Abstract

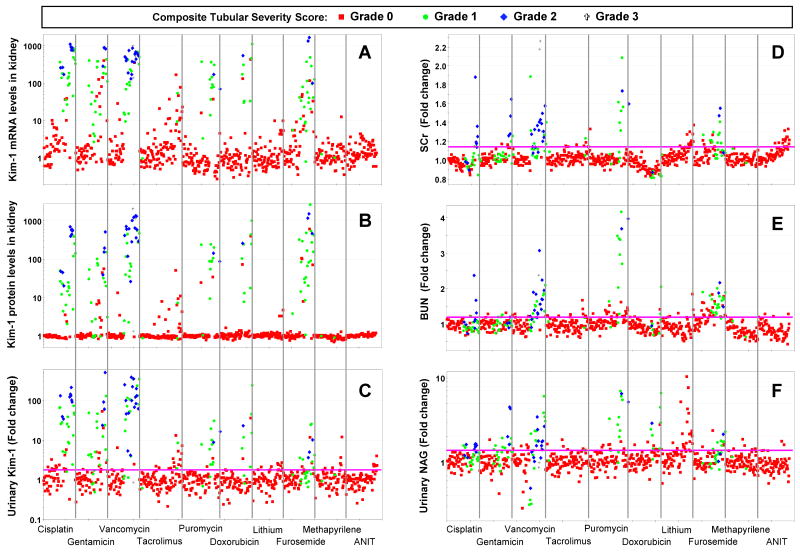
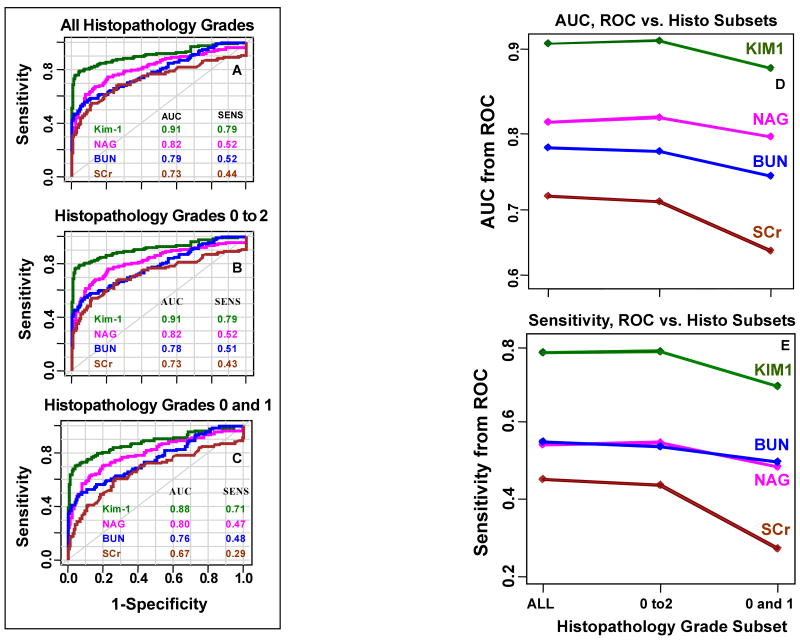
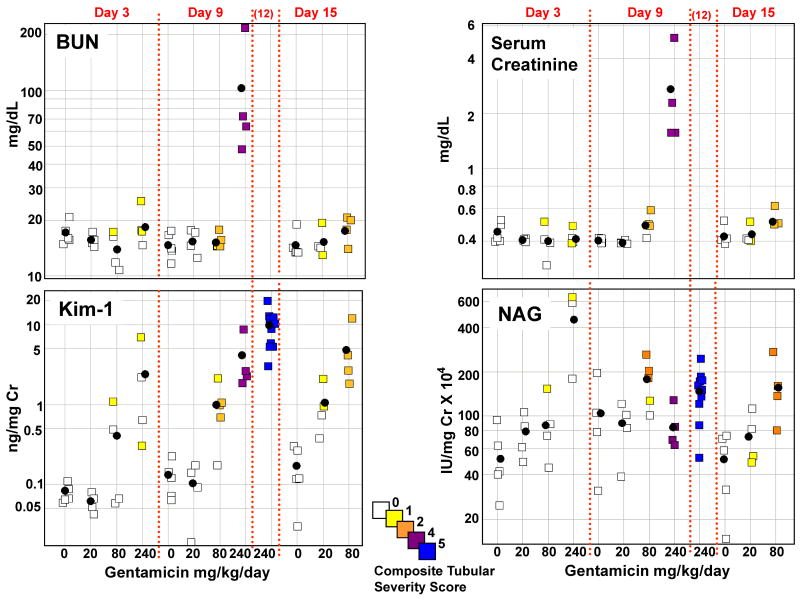
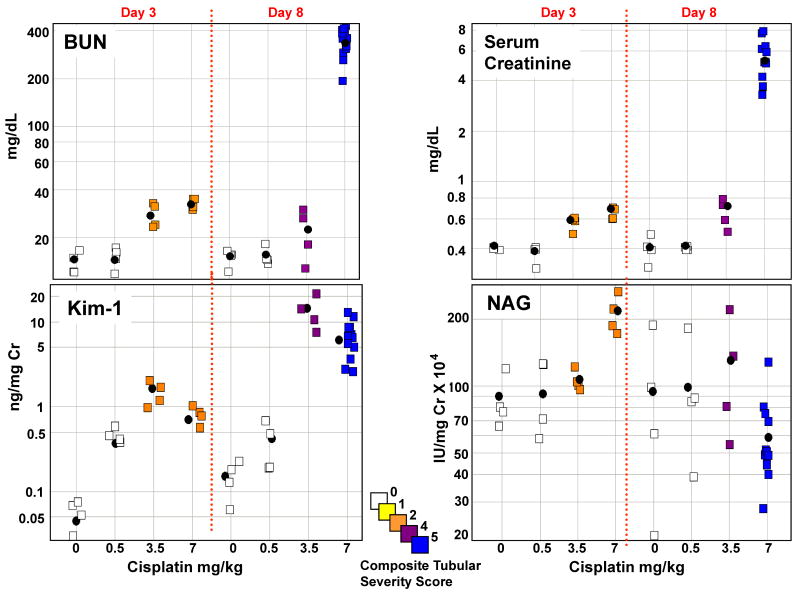
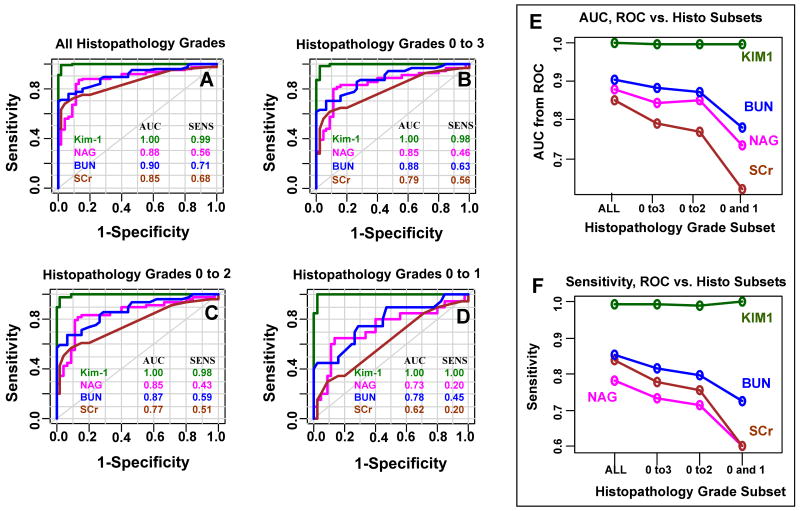
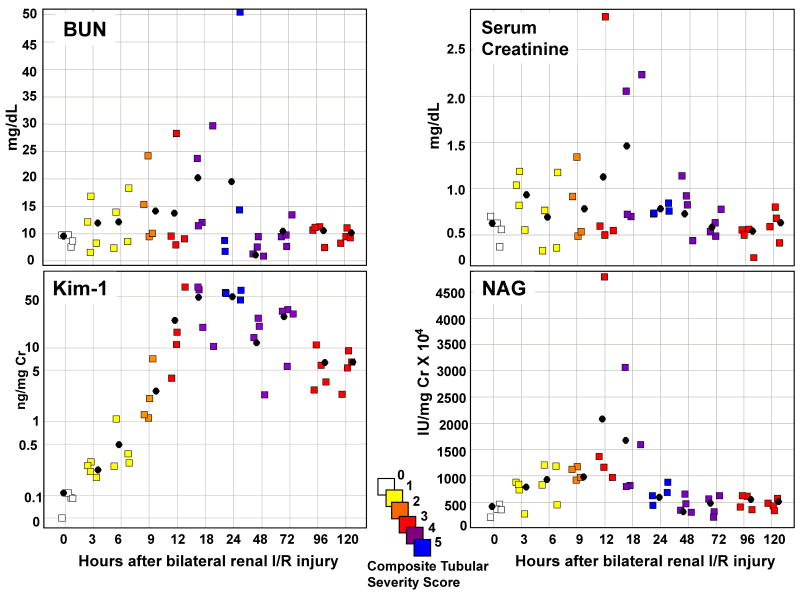
Kidney toxicity accounts both for the failure of many drug candidates as well as considerable patient morbidity. Whereas histopathology remains the gold standard for nephrotoxicity in animal systems, serum creatinine (SCr) and blood urea nitrogen (BUN) are the primary options for monitoring kidney dysfunction in humans. The transmembrane tubular protein kidney injury molecule-1 (Kim-1) was previously reported to be markedly induced in response to renal injury. Owing to the poor sensitivity and specificity of SCr and BUN, we used rat toxicology studies to compare the diagnostic performance of urinary Kim-1 to BUN, SCr and urinary N-acetyl-beta-D-glucosaminidase (NAG) as predictors of kidney tubular damage scored by histopathology. Kim-1 outperforms SCr, BUN and urinary NAG in multiple rat models of kidney injury. Urinary Kim-1 measurements may facilitate sensitive, specific and accurate prediction of human nephrotoxicity in preclinical drug screens. This should enable early identification and elimination of compounds that are potentially nephrotoxic.


Figures

Fig. 1
Fig. 1. Correlation of Kim-1 mRNA and protein levels in the kidney and urine respectively and comparison of urinary Kim-1 levels with serum creatinine, BUN and urinary NAG with severity grades of histopathology following a dose response and time course in 10 Novartis rat toxicology studies
Male Han Wistar rats (n=739) were dosed with a low, medium and high dose of eight mechanistically distinct nephrotoxicants and two hepatotoxicants and (A) renal Kim-1 mRNA, (B) renal Kim-1 protein and (C) urinary Kim-1 levels were measured. Conventional markers for kidney toxicity including (D) serum creatinine, (E) blood urea nitrogen and (F) urinary NAG were also measured and compared to different grades of kidney tubular histopathology. All values are represented as fold-changes versus the average values of study-matched and time-matched control animals on a logarithmic scale. The animals are ordered by study, within each study by dose-group (with increasing doses) and within each dose-group by termination time point (with increasing time). The symbols and the colors represent the histopathology readout for proximal tubular damage (red = no histopathology finding observed, green = grade 1, blue = grade 2, black = grade 3 on a 5 grade scale). The magenta lines represent the thresholds determined for 95% specificity in the ROC analysis for all histopathology grades.
Fig. 2
Fig. 2. Receiver operator characteristic curves for Novartis studies
Receiver operator characteristic curves from 8 different nephrotoxicant studies and 2 different hepatotoxicant studies from Novartis demonstrating sensitivity and specificity of BUN, serum creatinine, urinary Kim-1 and NAG with respect to a composite histopathology score that included (A) all histopathology grades; (B) histopathology grade 0 to 2; (C) histopathology grade 0 to 1. (D) Area under the curve and (E) Sensitivity (at 95% specificity) compared to the “gold standard”, histopathology. Animal numbers (n): nneg:283, npos: All=132, 0 to 2=129, 0 to 1=94.
Fig. 3
Fig. 3. Correlation of BUN, serum creatinine, urinary Kim-1 and urinary NAG with severity grades of histopathologic change following gentamicin treatment in Merck study
Male Sprague Dawley rats were administered gentamicin sulfate i.p. at 0, 20, 80, or 240 mg/kg/day (mkd) to groups of five rats/dose/time point and the animals were sacrificed on days 3, 9 or 15 for toxicity evaluation which included serum clinical chemistry (BUN, creatinine), urinary Kim-1 and NAG levels and renal histopathlogy (H&E staining). Open squares indicate grade 0 pathology and the composite tubular severity score is color coded from yellow (1), orange (2), purple (4) and blue (5). Black circles indicate average values of dose groups.
Fig. 4
Fig. 4. Correlation of BUN, serum creatinine, urinary Kim-1 and urinary NAG with severity grades of histopathologic change following cisplatin nephrotoxicity treatment in Merck study
Male Sprague Dawley rats were administered cisplatin i.p. (n=5/dose/time point) at doses of 0, 0.5, 3.5 or 7 mg/kg and rats were sacrificed on days 3 and 8 for toxicity evaluation which included serum clinical chemistry (BUN, creatinine), urinary Kim-1 and NAG levels and renal histopathlogy (H&E staining). Open squares indicate grade 0 pathology and the composite tubular severity score is color coded from yellow (1), orange (2), purple (4) and blue (5). Black circles indicate average values of dose groups.
Fig. 5
Fig. 5. Receiver operator characteristic curves for Merck studies
Receiver operator characteristic curves from four different nephrotoxicant studies demonstrating sensitivity and specificity of BUN, serum creatinine, urinary Kim-1 and NAG with respect to a composite histopathology score that included (A) all histopathology grades; (B) histopathology grade 0 to 3; (C) histopathology grade 0 to 2; (D) histopathology grade 0 and 1. (E) Area under the curve and (F) Sensitivity (at 95% specificity) of BUN, serum creatinine, urinary Kim-1 and NAG compared to the “gold standard”, histopathology. Animal number (n): nneg:45, npos: All=75, 0 to 3=54, 0 to 2=49, 0 to 1=20.
Fig. 6
Fig. 6. Comparison of Kim-1 with routinely used biomarkers as an early diagnostic indicator of kidney injury following 20 min bilateral renal ischemia/reperfusion injury
Male Wistar rats were subjected to 0 (sham) or 20 min of bilateral ischemia by clamping the renal pedicles for 20 min and then removing the clamps and confirming reperfusion. Two hours after reperfusion the rats were placed in metabolic cages and urine, blood and tissue collected at 3, 6, 9, 12, 18, 24, 48, 72, 96 and 120 h following reperfusion. Urinary Kim-1, blood urea nitrogen, serum creatinine, and urinary N-acetyl-β-D-glucosaminidase were measured and these levels were correlated to histopathology (H&E staining) as per methods. Open squares indicate grade 0 pathology and the composite tubular severity score is color coded from yellow (1), orange (2), red (3), purple (4) and blue (5).

Comment in

  • A roadmap for biomarker qualification.
    Warnock DG, Peck CC. Warnock DG, et al. Nat Biotechnol. 2010 May;28(5):444-5. doi: 10.1038/nbt0510-444. Nat Biotechnol. 2010. PMID: 20458313 No abstract available.

Similar articles

Cited by

References

    1. Chertow GM, Burdick E, Honour M, Bonventre JV, Bates DW. Acute kidney injury, mortality, length of stay, and costs in hospitalized patients. J Am Soc Nephrol. 2005;16:3365–3370. - PubMed
    1. Choudhury D, Ziauddin A. Drug-associated renal dysfunction and injury. Nature Clinical Practice Nephrology. 2005;2:80–91. - PubMed
    1. Bonventre JV, Vaidya VS, Schmouder R, Feig P, Dieterle F. New tools to detect kidney toxicity. Nature biotechnology. 2009 Submitted. - PMC - PubMed
    1. Ichimura T, et al. Kidney injury molecule-1 (KIM-1), a putative epithelial cell adhesion molecule containing a novel immunoglobulin domain, is up-regulated in renal cells after injury. J Biol Chem. 1998;273:4135–4142. - PubMed
    1. Amin RP, et al. Identification of putative gene based markers of renal toxicity. Environ Health Perspect. 2004;112:465–479. - PMC - PubMed

Publication types

MeSH terms