. 2010 Jul;6(7):1293-306.
doi: 10.1039/c003921g. Epub 2010 May 10.

Structure of the EGF receptor transactivation circuit integrates multiple signals with cell context

Affiliations

Structure of the EGF receptor transactivation circuit integrates multiple signals with cell context

Elizabeth J Joslin et al. Mol Biosyst. 2010 Jul.

Abstract

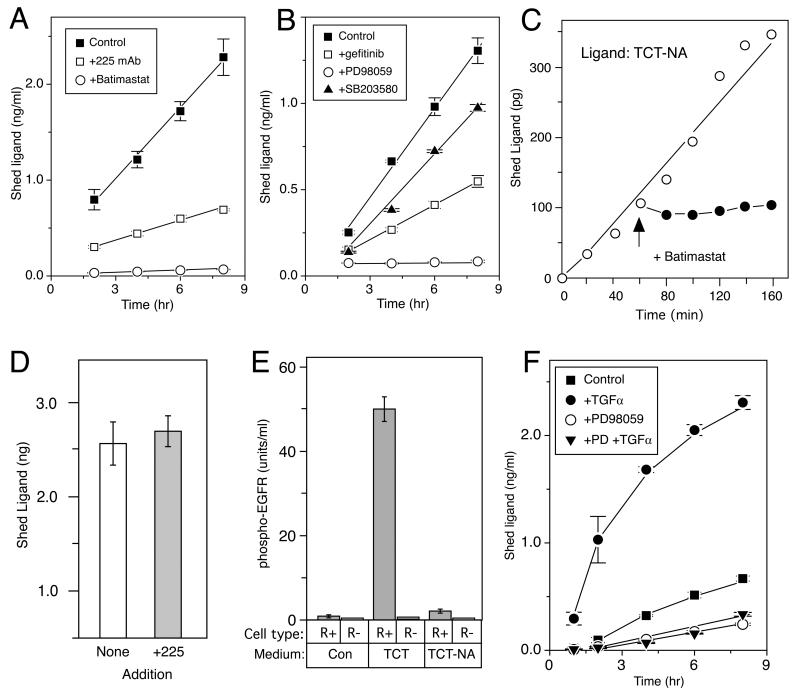
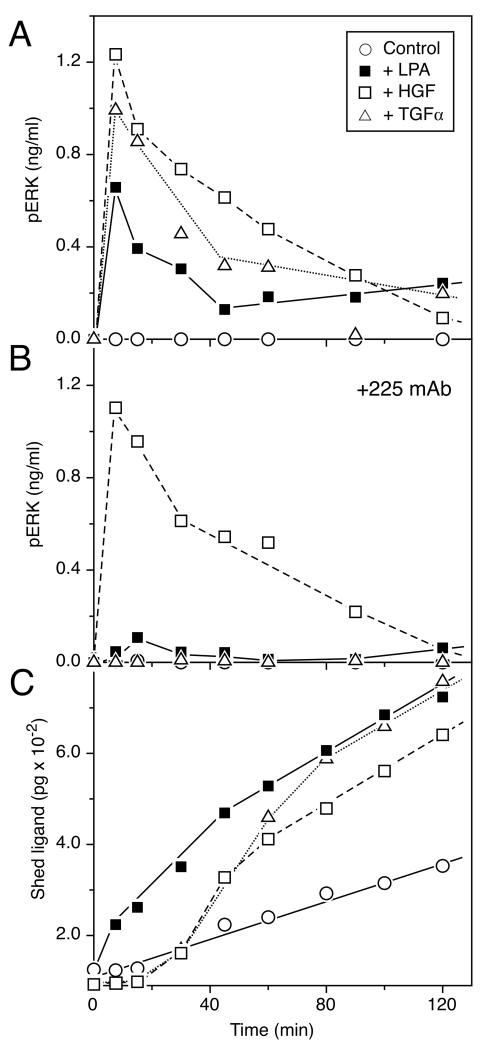
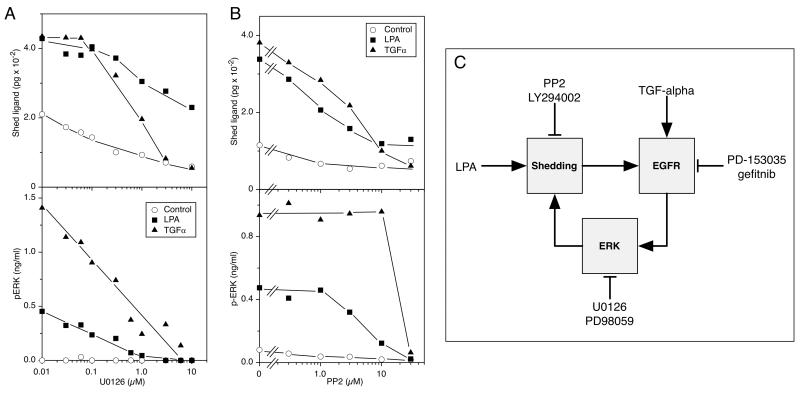
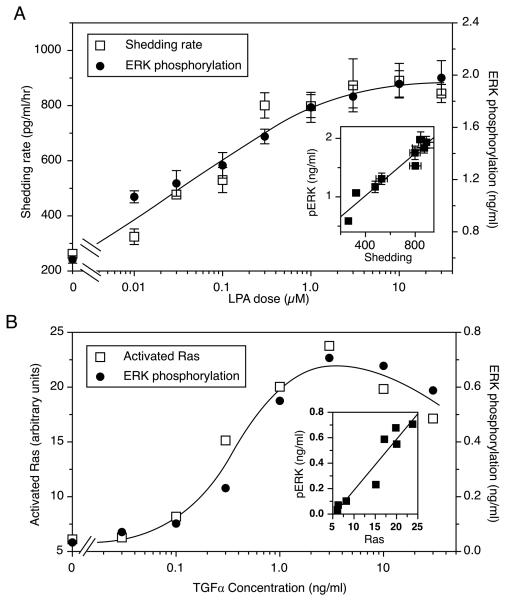
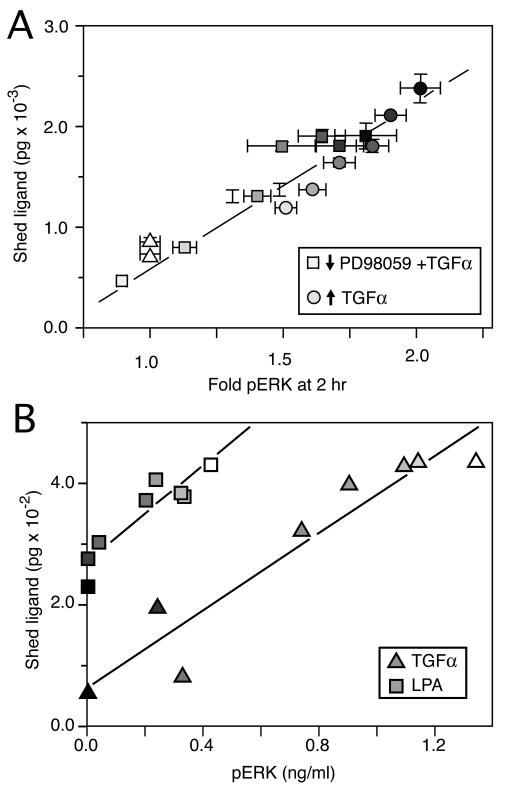
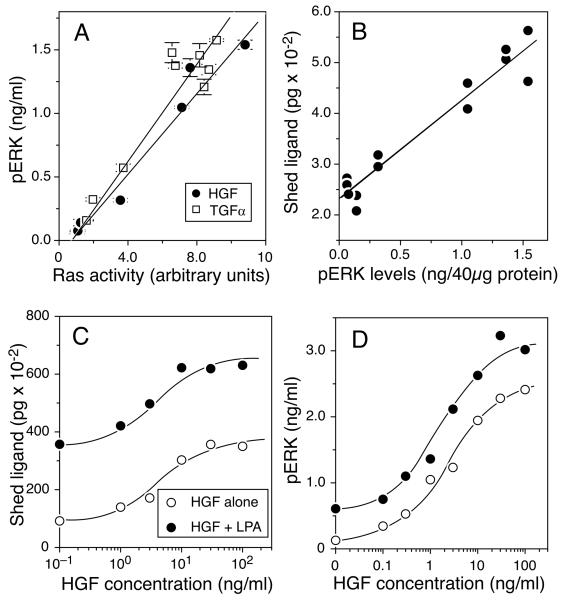
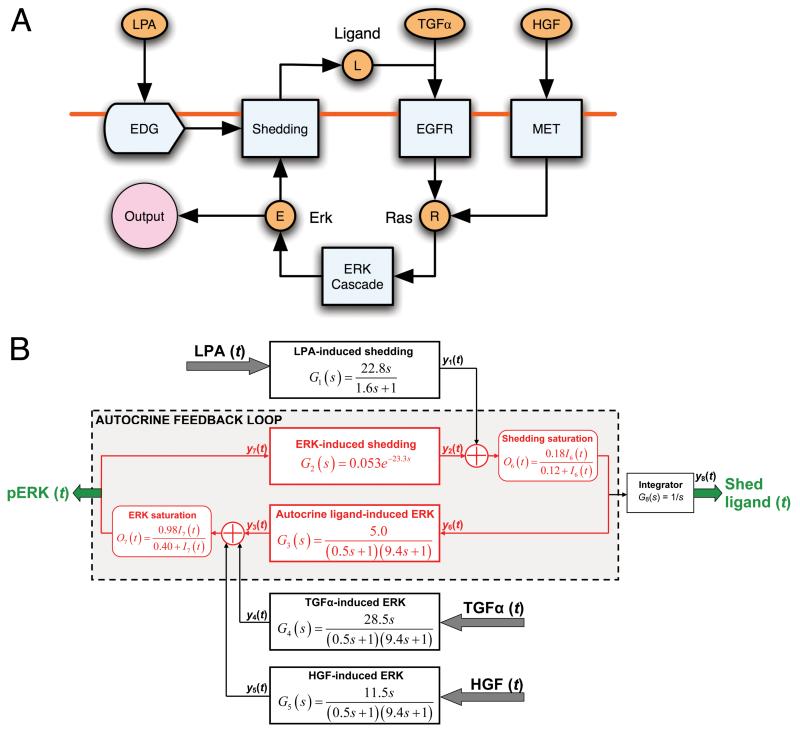
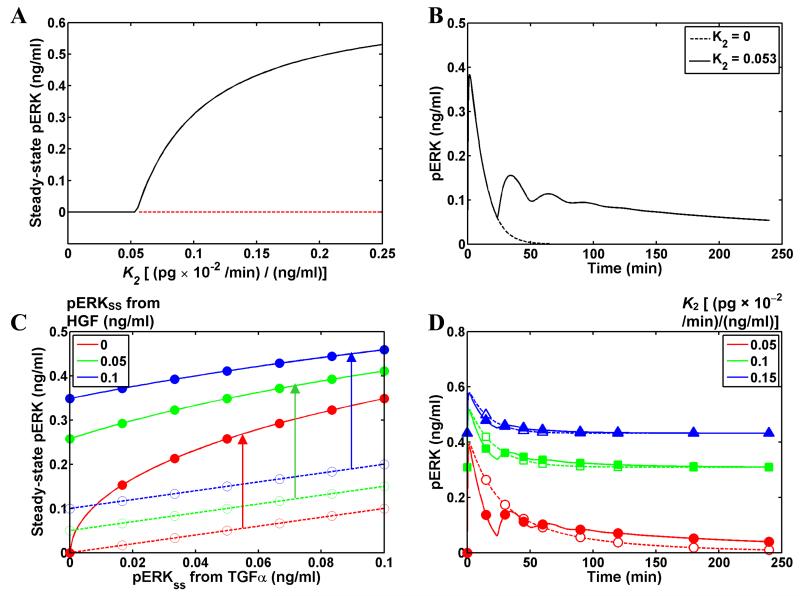
Transactivation of the epidermal growth factor receptor (EGFR) is thought to be a process by which a variety of cellular inputs can be integrated into a single signaling pathway through either stimulated proteolysis (shedding) of membrane-anchored EGFR ligands or by modification of the activity of the EGFR. As a first step towards building a predictive model of the EGFR transactivation circuit, we quantitatively defined how signals from multiple agonists were integrated both upstream and downstream of the EGFR to regulate extracellular signal regulated kinase (ERK) activity in human mammary epithelial cells. By using a "non-binding" reporter of ligand shedding, we found that transactivation triggers a positive feedback loop from ERK back to the EGFR such that ligand shedding drives EGFR-stimulated ERK that in turn drives further ligand shedding. Importantly, activated Ras and ERK levels were nearly linear functions of ligand shedding and the effect of multiple, sub-saturating inputs was additive. Simulations showed that ERK-mediated feedback through ligand shedding resulted in a stable steady-state level of activated ERK, but also showed that the extracellular environment can modulate the level of feedback. Our results suggest that the transactivation circuit acts as a context-dependent integrator and amplifier of multiple extracellular signals and that signal integration can effectively occur at multiple points in the EGFR pathway.


Figures

Figure 1
Figure 1. EGFR autocrine ligands stimulate their own release by activating ERK
(A) Accumulation of EGF in medium is inhibited by blocking the EGFR or inhibiting cell surface proteolysis. After 16 hours in serum-free media, cells expressing the chimeric ligand TCT were switched to fresh serum-free media alone or containing 10 μg/ml 225 mAb or 225 mAb in addition to 10 μM batimastat. Media from triplicate wells was collected at 2-hour intervals, assayed for EGF with an ELISA. Error bars represent standard deviation. (B) Effects of inhibitors on ligand release. After 16 hours in serum-free media, TCT cells were pre-incubated with the indicated inhibitors for 30 minutes. Cells were then switched to either fresh serum-free media alone (control) or containing 1 μM Gefitinib, 10 μM SB203580 or 25 μM PD98059. Other conditions same as A. (C) Cells expressing TCT-NA were switched to fresh serum-free medium at t=0, and the amount of immunoreactive EGF in the medium was determined by ELISA (open circles). At 1hr, batimastat was added to a final concentration of 10μM to a parallel set of cells (closed circles). (D) Blocking the EGFR has no significant effect on release of TCT-NA. Cells expressing TCT-NA were changed to serum-free medium either in the absence (open bars) or presence (closed bars) of 10μg/ml of 225 mAb. After 8 hr, the medium was collected and the concentration of immunoreactive EGF was measured by ELISA. Error bars are SD from triplicate wells. (E) TCT-NA fails to activate the EGFR. Serum-free conditioned medium was collected from an overnight incubation of WT HMEC (control medium) or from cells expressing either TCT or TCT-NA. Immunoreactive levels of EGF were determined by ELISA and the final concentrations of both ligands were adjusted to 5ng/ml. Parental B82 mouse fibroblasts lacking the EGFR (R-) or transfected with the human EGFR (R+) were incubated with the indicated medium for 10 min. The levels of phospho-EGFR were measured by ELISA. Error bars are SD from triplicate wells. (F) Shedding of the non-bindable EGFR ligand TCT-NA is stimulated by TGFα and inhibited by ERK inhibitors. After 16 hours in serum-free media, cells were switched to fresh serum-free media alone or medium containing 20 ng/ml TGFα, both in the presence or absence of 25 μM PD98059. Other conditions same as A.
Figure 2
Figure 2. Kinetics of ERK activation and induced shedding
(A) Kinetics of ERK phosphorylation using 3ng/ml TGFα, 3μM LPA or 20ng/ml HGF as stimulants. Cells were seeded at 350,000 cells per 6-well dish on day 1 and shifted into serum-free medium (DFB) on day 2. Following an 18-hour incubation, ligand was added for the indicated time at which point cell lysates were collected and assayed for pERK by ELISA as described in Methods. (B) Same as A, but cells were first pretreated for 1 h with 10μg/ml 225 mAb to block the EGFR. (C) Kinetics of shedding of cells expressing TCT-NA using the same conditions as A except that cells were washed in DFB and then placed in 1 ml of fresh DFB +/− stimulus. The medium was then collected at the indicated times. The results are the average of two independent experiments.
Figure 3
Figure 3. Differential effect of inhibitors on shedding and ERK phosphorylation
(A) Inhibiting MEK blocks TGFα-stimulated shedding and ERK, but only blocks LPA-stimulated ERK. Upper panel - cells expressing TCT-NA (840K per well) were changed to serum-free medium overnight before a 1 hr treatment with in the indicated concentration of U0126. LPA (0.5 μM) or TGF (2.5 ng/ml) was added in a small aliquot (20μL) and the cells incubated for an additional 90 min prior to collecting the medium and measuring the level of immunoreactive EGF by ELISA. Bottom panel – Same as in top panel except that the cells were treated 10 min with agonists after which they were rinsed in ice-cold saline and lysed in detergent as described in Methods. The levels of pERK were then measured by ELISA. (B) Inhibiting Src blocks both TGFα and LPA-induced shedding, but only inhibits LPA-stimulated ERK. Conditions same as A except that PP2 was used as the inhibitor and the cells were incubated with agonists for 15 min before measuring the levels of pERK by ELISA. (C) Relationships between effects of different inhibitors. The inhibitors are associated with the processes that are preferentially blocked.
Figure 4
Figure 4. Primary signaling nodes in transactivation circuit are linearly coupled
(A) ERK activation is directly proportional to LPA-induced shedding. Cells expressing TCT-NA (825K per well) were switched to 900μl fresh medium for 1hr and then brought to the indicated concentrations of LPA using 100μl of stock. After an additional hour, the medium was collected and the levels of immunoreactive EGF were measured using an ELISA. Data is average of duplicate experiments. Parallel plates of HMEC were stimulated with LPA for 5 minutes and then cell lysates were collected and measured for pERK using an ELISA. Data is average of replicate samples. Insert: Shed ligand plotted against pERK levels. Units are same as main figure and line is from linear regression. (B) ERK activation is proportional to Ras activation. Cells were plated at a density of 6 × 10⁶ cells per 150mm plates and grown for 24h. After shifting to DFB medium overnight, cells were stimulated with the indicated concentrations of TGFα for 15 min and lysates were collected for the Ras assay as described in the Methods. The same lysates were used to measure pERK levels by ELISA. The results are the average of three experiments. Insert: the levels of activated Ras and pERK at each TGFα concentration. Units are same as main figure.
Figure 5
Figure 5. Shedding is proportional to pERK levels
(A) Cells were incubated with increasing levels of TGFα (0.6 to 20ng/ml) and the levels of pERK were measured at 2 hours using an in-cell western as described in the Methods. Ligand release was determined over 8 hours by ELISA and normalized to 10 cells. The amount of shed ligand is shown as a function of the observed levels of pERK (circles). Alternately, cells were pre-incubated with increasing concentrations of PD98059 (0.2-25μM) for 30-minutes before stimulation with 20 ng/ml of TGFα (squares). Values from nonstimulated cells are triangles. Error bars represent standard deviation from triplicate wells. (B) Differential effect of inhibiting MEK on TGFα and LPA-stimulated shedding. Data is the same as shown in Fig. 3A in which the effect of different concentration of U0126 on both ligand shedding and pERK levels were ascertained. LPA (0.5 μM; squares) or TGF (2.5 ng/ml; triangles) was added to cells treated with up to 10μM U0126. The relationship between the levels of pERK and shed ligand observed at each concentration of U0126 is shown. All conditions are as described in Fig. 3A.
Figure 6
Figure 6. ERK signals from LPA and HGF are additive through the transactivation circuit
(A) Cells were stimulated with TGFα (0.03-100ng/ml) or HGF (0.3-100ng/ml) for 5 minutes before collecting cell lysates for measuring the levels of activated Ras and pERK as described in Fig. 4b. Error bars represent standard deviation from triplicate samples. The lines are from linear regression. (B) Cells expressing TCT-NA were treated for 1 hr with 225mAb to block the EGFR followed by the addition of different concentrations of HGF (0.1-100ng/ml) for 1hr to measure ligand shedding or 15 min to measure pERK levels as described in Fig. 4a. (C) Cells were stimulated with HGF in either the presence or absence of a half-maximal dose of LPA (0.5μM) for 1hr. The amount of immunoreactive EGF in the medium was then measured as described in Fig 4a. (D) Cells were incubated with the indicated concentration of HGF in the presence (closed circles) and absence (open circles) of 0.1μM LPA. The levels of activated ERK were measured by ELISA after 30 min as described in Methods. Data is average of duplicate experiments.
Figure 7
Figure 7. Model for the transactivation circuit
(A) Regulatory topology in terms of functional modules. The inputs are LPA, TGFa and HGF working through their respective receptors (EDG, EGFR or MET. The nodes measured in this study are indicated by circles. (B) Mathematical model in terms of transfer functions. The model consists of five core linear modules (large rectangles). The input-output characteristics of these modules are determined by the transfer functions (TFs) shown with the boxes. Module numbering is reflected in the TF expression and the output variable for each module. An ‘s’ in the numerator of the TF (modules 1, 4 and 5) indicates an adaptive response – a step input results in a transient output. A term of type ‘ etds ’ (module 2) indicates that the module responds to the input after a dead-time of td minutes. Terms of type ‘ τs+1 ’ in the denominator (modules 1, 3-5) capture the sluggishness of the response. The overall ligand shedding rate is a sum of the shedding rates induced by LPA (y1) and ERK activity (y2). The overall ERK activity is the sum of the ERK activities induced by autocrine ligand (y3), TGFα (y4), and HGF (y5). The net shedding rate and ERK activity are modified using the static saturation filters shown in modules 6 and 7 respectively (rounded rectangles). The ligand shedding rate is integrated by module 8 to yield the total amount of shed ligand. The structure of the model and the TF functional forms were chosen based on the qualitative features of ERK and ligand shedding dynamics observed in our experiments. Parameters indicated within the modules were determined by fitting the model outputs simultaneously to all of our time-course and dose response experiments.
Figure 8
Figure 8. Dynamic behavior of the transactivation circuit
For the calculations shown in all panels, parameters were held at the values shown in Fig. 7 unless specified otherwise. (A) Steady-state pERK levels were computed for the autocrine feedback loop, and are plotted as function of K2 the gain of the ERK-induced shedding module. The stable steady state is depicted using a solid black line. The red line indicates the unstable steady state at pERK = 0. (B) The pERK output of the transactivation circuit in response to 100pg/ml TGFα is plotted as a function of time in the absence (dotted line) and presence (solid line) of autocrine feedback. (C) The steady-state pERK output of the transactivation circuit (solid lines, filled circles) is plotted for cases where TGFα and HGF make sustained contributions to ERK activity at the levels specified in the x-axis and the legend respectively. Dotted lines and open markers indicate the expected steady-state pERK output in the absence of the autocrine feedback loop. Arrows are presented to enable comparison between corresponding cases with and without feedback. (D) The pERK output of the transactivation circuit in response to 100pg/ml TGFα is plotted as a function of time in the absence (dotted lines and open markers) and presence (solid lines and filled markers) of a time delay in ERK-induced shedding. Results are shown for the three different values of feedback gain K2 indicated in the legend.

Similar articles

Cited by

References

    1. Bhola NE, Grandis JR. Front Biosci. 2008;13:1857–1865. - PubMed
    1. Citri A, Yarden Y. Nat Rev Mol Cell Biol. 2006;7:505–516. - PubMed
    1. Fischer OM, Hart S, Gschwind A, Ullrich A. Biochem. Soc. Trans. 2003;31:1203–1208. - PubMed
    1. Prenzel N, Fischer OM, Streit S, Hart S, Ullrich A. Endocr. Rela.t Cancer. 2001;8:11–31. - PubMed
    1. Zwick E, Hackel PO, Prenzel N, Ullrich A. Trends Pharmacol. Sci. 1999;20:408–412. - PubMed

Publication types

MeSH terms