

Assessment of free dye in solutions of dual-labeled antibody conjugates for in vivo molecular imaging
- PMID: 20458634
- PMCID: PMC5312670
- DOI: 10.1007/s11307-010-0328-7
Assessment of free dye in solutions of dual-labeled antibody conjugates for in vivo molecular imaging
Abstract
Purpose: Recent preclinical and clinical studies show that dyes that excite and fluoresce in the near-infrared range may be used for tracking and detecting disease targets in vivo. A method for quantifying free dye molecules in antibody conjugate preparations is required for agent batch release and for translation into the clinic.
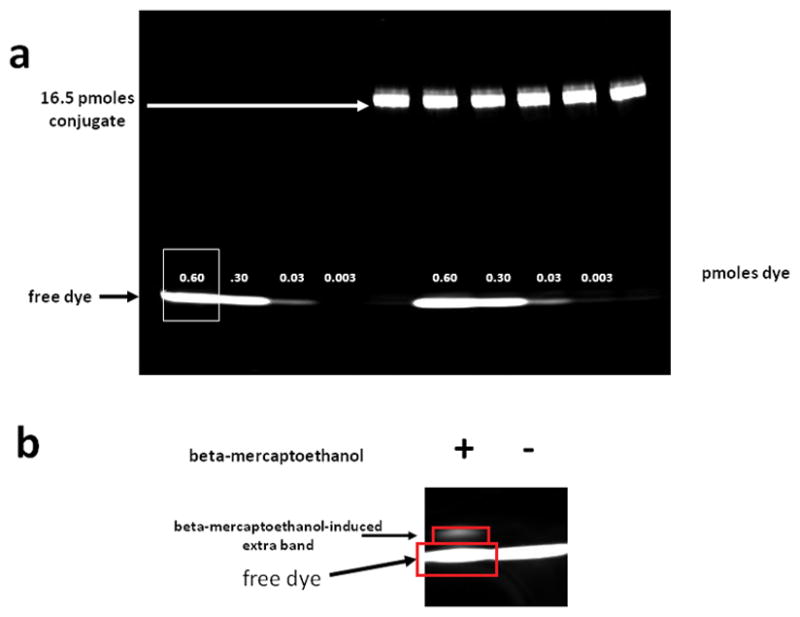
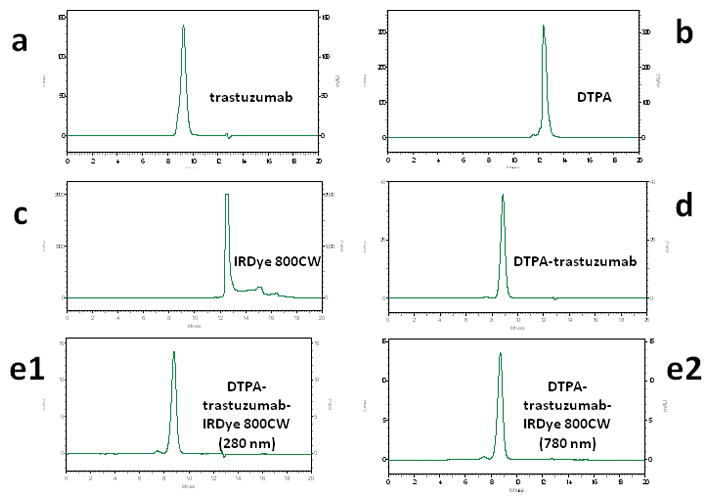
Procedures: Herein, we developed and validated a SDS-PAGE method to determine the percentage of free IRDye 800 CW in (DTPA)(n)-trastuzumab-(IRDye 800)(m) conjugate sample preparations in which high-performance liquid chromatography (HPLC) assessment of free dye was not possible.
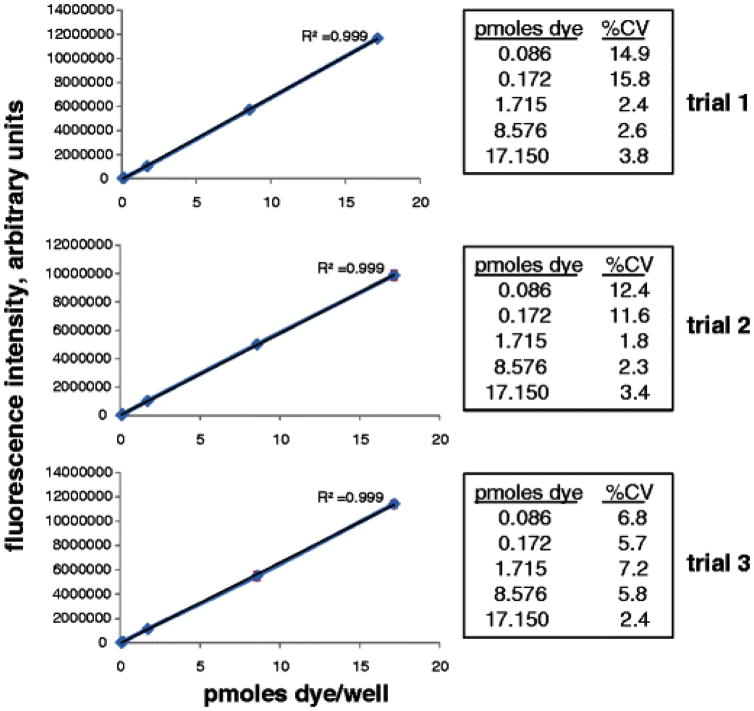
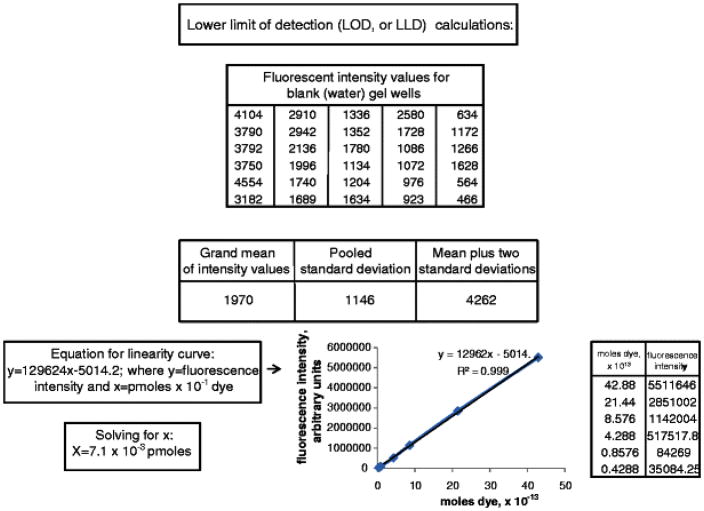
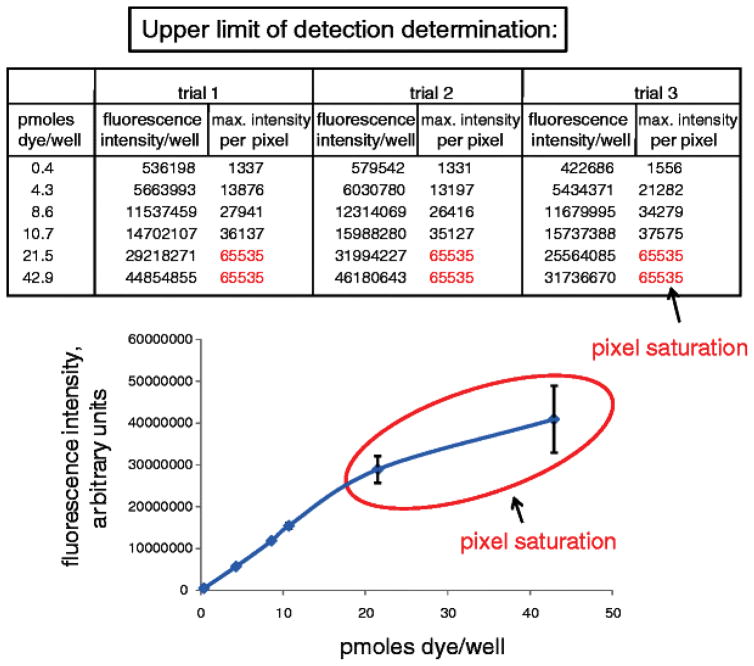
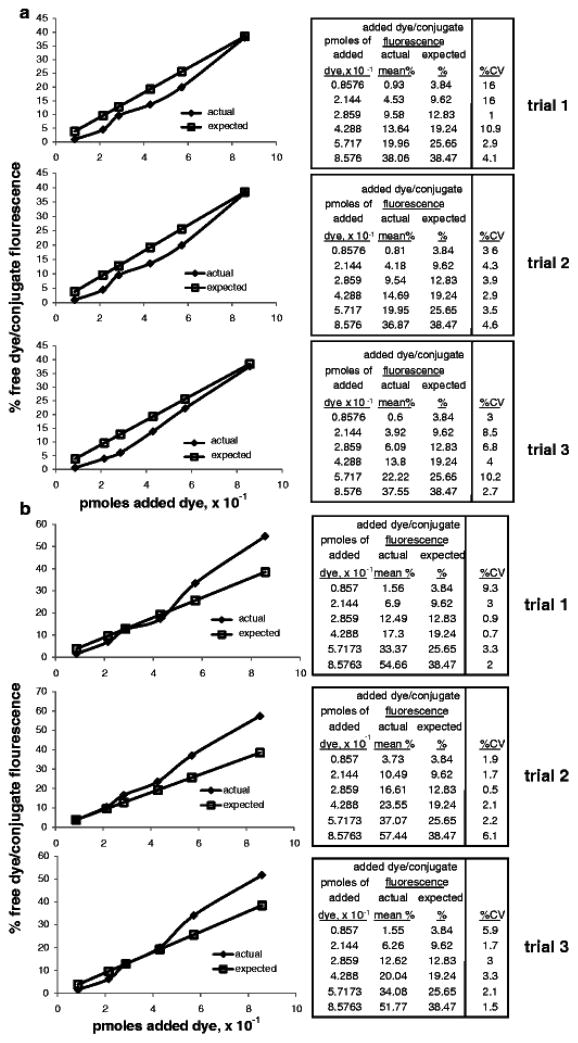
Results: The SDS-PAGE assay was accurate and valid for free IRDye 800 CW amounts between 38 and 4 mol% of total dye. Gel sample preparation reagent affected the specificity of the assay, and lower and upper limits of quantitation and detection were determined.
Conclusion: This method may be applicable to other near-infrared dye-conjugated antibody-based imaging agents in which HPLC assessment of purity is not feasible. This validated method for quality assurance will facilitate the translation of dual-labeled antibody conjugates for nuclear and optical imaging.
Figures
Similar articles
-
Dual-labeled trastuzumab-based imaging agent for the detection of human epidermal growth factor receptor 2 overexpression in breast cancer.J Nucl Med. 2007 Sep;48(9):1501-10. doi: 10.2967/jnumed.107.042234. J Nucl Med. 2007. PMID: 17785729
-
A kit to prepare (111)In-DTPA-trastuzumab (Herceptin) Fab fragments injection under GMP conditions for imaging or radioimmunoguided surgery of HER2-positive breast cancer.Nucl Med Biol. 2011 Jan;38(1):129-36. doi: 10.1016/j.nucmedbio.2010.06.010. Epub 2010 Sep 1. Nucl Med Biol. 2011. PMID: 21220136
-
Synthesis and testing of a binary catalytic system for imaging of signal amplification in vivo.Bioconjug Chem. 2007 Jul-Aug;18(4):1123-30. doi: 10.1021/bc060392k. Epub 2007 May 18. Bioconjug Chem. 2007. PMID: 17508710
-
Stability assessment of antibody-drug conjugate Trastuzumab emtansine in comparison to parent monoclonal antibody using orthogonal testing protocol.J Pharm Biomed Anal. 2018 Feb 20;150:268-277. doi: 10.1016/j.jpba.2017.12.022. Epub 2017 Dec 13. J Pharm Biomed Anal. 2018. PMID: 29258046
-
Poly(ethylene glycol)-conjugated anti-EGF receptor antibody C225 with radiometal chelator attached to the termini of polymer chains.Bioconjug Chem. 2001 Jul-Aug;12(4):545-53. doi: 10.1021/bc0001443. Bioconjug Chem. 2001. PMID: 11459459
Cited by
-
Dual-labeling strategies for nuclear and fluorescence molecular imaging: a review and analysis.Mol Imaging Biol. 2012 Jun;14(3):261-76. doi: 10.1007/s11307-011-0528-9. Mol Imaging Biol. 2012. PMID: 22160875 Free PMC article. Review.
-
Preclinical characterization and validation of a dual-labeled trastuzumab-based imaging agent for diagnosing breast cancer.Chin J Cancer Res. 2015 Feb;27(1):74-82. doi: 10.3978/j.issn.1000-9604.2015.01.02. Chin J Cancer Res. 2015. PMID: 25717229 Free PMC article.
-
Safety and Stability of Antibody-Dye Conjugate in Optical Molecular Imaging.Mol Imaging Biol. 2021 Feb;23(1):109-116. doi: 10.1007/s11307-020-01536-2. Epub 2020 Sep 3. Mol Imaging Biol. 2021. PMID: 32880818 Free PMC article. Clinical Trial.
-
Seeing it through: translational validation of new medical imaging modalities.Biomed Opt Express. 2012 Apr 1;3(4):764-76. doi: 10.1364/BOE.3.000764. Epub 2012 Mar 22. Biomed Opt Express. 2012. PMID: 22574264 Free PMC article.
-
Tracking Antibody Distribution with Near-Infrared Fluorescent Dyes: Impact of Dye Structure and Degree of Labeling on Plasma Clearance.Mol Pharm. 2017 May 1;14(5):1623-1633. doi: 10.1021/acs.molpharmaceut.6b01091. Epub 2017 Mar 31. Mol Pharm. 2017. PMID: 28294622 Free PMC article.
References
-
- Sevick-Muraca EM, Sharma R, Rasmussen JC, Marshall MV, Wendt JA, Pham HQ, Bonefas E, Houston JP, Sampath L, Adams KE, Blanchard DK, Fisher RE, Chiang SB, Elledge R, Mawad ME. Imaging of lymph flow in breast cancer patients after microdose administration of a near-infrared fluorophore: feasibility study. Radiology. 2008;246(3):734–41. - PMC - PubMed
-
- Meyers CLF, Meyers DJ. Curr Protoc Nucleic Acid Chem. Vol. 34. John Wiley & Sons, Inc; 2008. Thin-Layer Chromatography; pp. A.3D.1–A.3D.13. - PubMed
-
- Dhesy-Thind B, Pritchard KI, Messersmith H, O’Malley F, Elavathil L, Trudeau M. HER2/neu in systemic therapy for women with breast cancer: a systematic review. Breast Cancer Res Treat. 2008;109(2):209–29. - PubMed
Publication types
MeSH terms
Substances
Grants and funding
LinkOut - more resources
Full Text Sources
