

Additional correction for energy transfer efficiency calculation in filter-based Forster resonance energy transfer microscopy for more accurate results
- PMID: 20459222
- PMCID: PMC2874045
- DOI: 10.1117/1.3407655
Additional correction for energy transfer efficiency calculation in filter-based Forster resonance energy transfer microscopy for more accurate results
Abstract
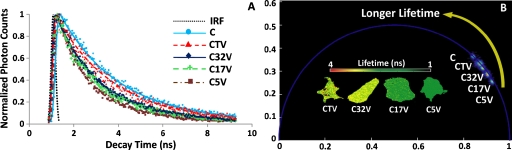
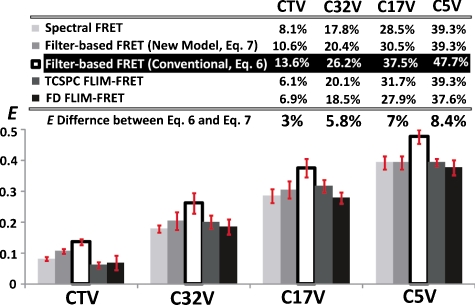
Forster resonance energy transfer (FRET) microscopy is commonly used to monitor protein interactions with filter-based imaging systems, which require spectral bleedthrough (or cross talk) correction to accurately measure energy transfer efficiency (E). The double-label (donor+acceptor) specimen is excited with the donor wavelength, the acceptor emission provided the uncorrected FRET signal and the donor emission (the donor channel) represents the quenched donor (qD), the basis for the E calculation. Our results indicate this is not the most accurate determination of the quenched donor signal as it fails to consider the donor spectral bleedthrough (DSBT) signals in the qD for the E calculation, which our new model addresses, leading to a more accurate E result. This refinement improves E comparisons made with lifetime and spectral FRET imaging microscopy as shown here using several genetic (FRET standard) constructs, where cerulean and venus fluorescent proteins are tethered by different amino acid linkers.
Figures
Similar articles
-
Energy migration alters the fluorescence lifetime of Cerulean: implications for fluorescence lifetime imaging Forster resonance energy transfer measurements.J Biomed Opt. 2008 May-Jun;13(3):031204. doi: 10.1117/1.2940367. J Biomed Opt. 2008. PMID: 18601528 Free PMC article.
-
Quantitative Förster resonance energy transfer efficiency measurements using simultaneous spectral unmixing of excitation and emission spectra.J Biomed Opt. 2013 Feb;18(2):26024. doi: 10.1117/1.JBO.18.2.026024. J Biomed Opt. 2013. PMID: 23423332
-
Characterization of an improved donor fluorescent protein for Forster resonance energy transfer microscopy.J Biomed Opt. 2008 May-Jun;13(3):031203. doi: 10.1117/1.2939094. J Biomed Opt. 2008. PMID: 18601527 Free PMC article.
-
Protein localization in living cells and tissues using FRET and FLIM.Differentiation. 2003 Dec;71(9-10):528-41. doi: 10.1111/j.1432-0436.2003.07109007.x. Differentiation. 2003. PMID: 14686950 Review.
-
Fluorescence resonance energy transfer (FRET) and competing processes in donor-acceptor substituted DNA strands: a comparative study of ensemble and single-molecule data.J Biotechnol. 2002 Jan;82(3):211-31. doi: 10.1016/s1389-0352(01)00039-3. J Biotechnol. 2002. PMID: 11999691 Review.
Cited by
-
Automated selection of regions of interest for intensity-based FRET analysis of transferrin endocytic trafficking in normal vs. cancer cells.Methods. 2014 Mar 15;66(2):139-52. doi: 10.1016/j.ymeth.2013.08.017. Epub 2013 Aug 28. Methods. 2014. PMID: 23994873 Free PMC article.
-
FRET microscopy in 2010: the legacy of Theodor Förster on the 100th anniversary of his birth.Chemphyschem. 2011 Feb 25;12(3):462-74. doi: 10.1002/cphc.201000664. Epub 2010 Dec 29. Chemphyschem. 2011. PMID: 21344587 Free PMC article. Review.
-
Investigating protein-protein interactions in living cells using fluorescence lifetime imaging microscopy.Nat Protoc. 2011 Aug 11;6(9):1324-40. doi: 10.1038/nprot.2011.364. Nat Protoc. 2011. PMID: 21886099 Free PMC article.
-
Visualizing Neurons Under Tension In Vivo with Optogenetic Molecular Force Sensors.Methods Mol Biol. 2023;2600:239-266. doi: 10.1007/978-1-0716-2851-5_16. Methods Mol Biol. 2023. PMID: 36587102 Free PMC article.
-
Förster resonance energy transfer as a tool to study photoreceptor biology.J Biomed Opt. 2010 Nov-Dec;15(6):067001. doi: 10.1117/1.3505023. J Biomed Opt. 2010. PMID: 21198205 Free PMC article.
References
-
- Tron L., Szollosi J., Damjanovich S., Helliwell S. H., Arndt-Jovin D. J., and Jovin T. M., “Flow cytometric measurement of fluorescence resonance energy transfer on cell surfaces, quantitative evaluation of the transfer efficiency on a cell-by-cell basis,” Biophys. J. BIOJAU 45(5), 939–946 (1984).10.1016/S0006-3495(84)84240-X - DOI - PMC - PubMed
-
- Kam Z., Volberg T., and Geiger B., “Mapping of adherens junction components using microscopic resonance energy transfer imaging,” J. Cell. Sci. JNCSAI 108(Pt 3), 1051–1062 (1995). - PubMed
