Comparative Study
. 2010 Mar-Apr;15(2):026006.
doi: 10.1117/1.3368999.

Quantitative evaluation of high-density diffuse optical tomography: in vivo resolution and mapping performance

Affiliations
Comparative Study

Quantitative evaluation of high-density diffuse optical tomography: in vivo resolution and mapping performance

Brian R White et al. J Biomed Opt. 2010 Mar-Apr.

Abstract

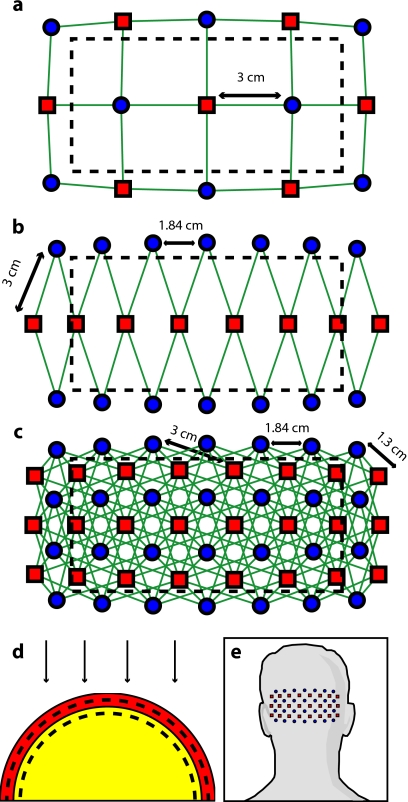
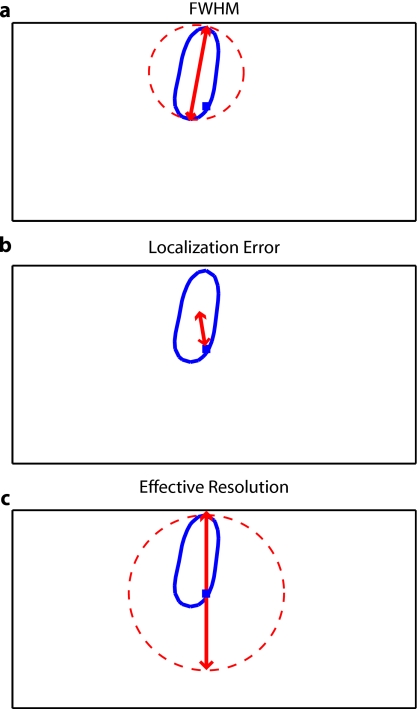
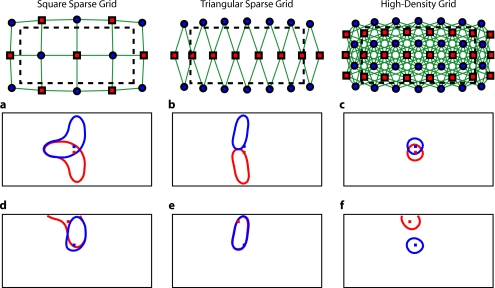
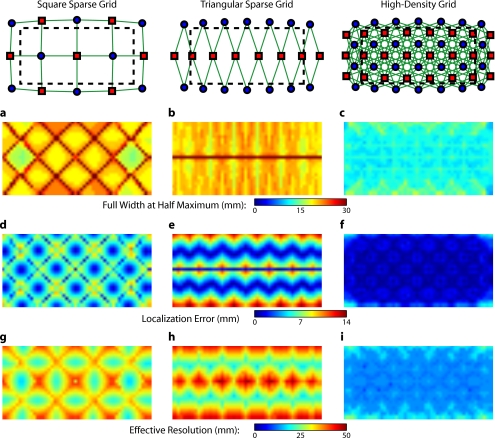
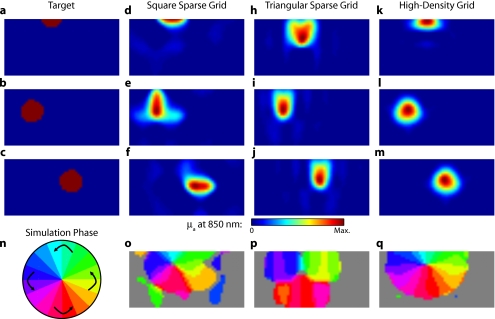
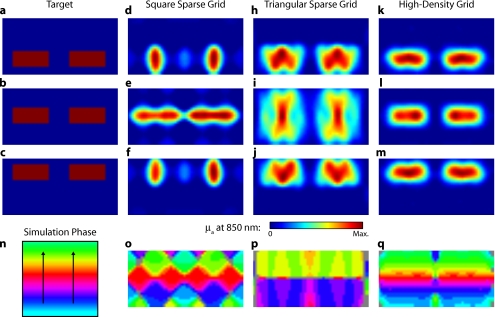
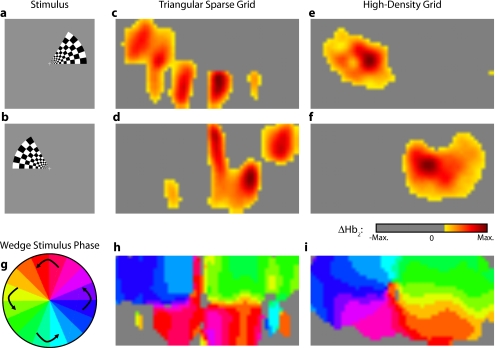
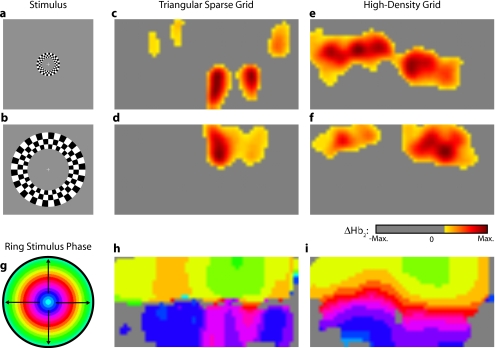
Despite the unique brain imaging capabilities and advantages of functional near-infrared spectroscopy (fNIRS), including portability and comprehensive hemodynamic measurement, widespread acceptance in the neuroimaging community has been hampered by low spatial resolution and image localization errors. While recent technical developments such as high-density diffuse optical tomography (HD-DOT) have, in principle, been shown to have superior in silico image quality, the majority of optical imaging studies are still conducted with sparse fNIRS arrays, perhaps partially because the performance increases of HD-DOT appear incremental. Without a quantitative comparative analysis between HD-DOT and fNIRS, using both simulation and in vivo neuroimaging, the implications of the new HD-DOT technology have been difficult to judge. We present a quantitative comparison of HD-DOT and two commonly used fNIRS geometries using (1) standard metrics of image quality, (2) simulated brain mapping tasks, and (3) in vivo visual cortex mapping results in adult humans. The results show that better resolution and lower positional errors are achieved with HD-DOT and that these improvements provide a substantial advancement in neuroimaging capability. In particular, we demonstrate that HD-DOT enables detailed phase-encoded retinotopic mapping, while sparse arrays are limited to imaging individual block-design visual stimuli.


Figures

Figure 1
Figure 1
Diffuse optical imaging optode arrays. Sources are red squares, detectors are blue circles, and measurements are green lines. (a) Schematic of the square sparse imaging array. The two-dimensional (2-D) grid with 3-cm spacing was conformed to an 8-cm-radius sphere. Shown is a projection of the resulting three-dimensional (3-D) optode locations. (b) Schematic of the triangular sparse imaging array. (c) Schematic of the high-density imaging array. First-nearest neighbors have 1.3-cm spacing and second-nearest neighbors have 3-cm spacing. (d) Cross section through the 3-D head model. The inner brain region (yellow) has a radius of 7 cm, and the outer skin/skull region is 1 cm thick. All images shown in later figures are posterior coronal projections (direction of view noted by arrows) of a 1-cm-thick shell around the cortical surface (dashed lines). (e) Schematic of the high-density imaging array placed over the occipital cortex of a human subject. (Color online only.)
Figure 2
Figure 2
Definitions of imaging metrics for point-spread function analysis shown using a simulated image reconstruction from the triangular sparse array. The target perturbation is the blue square, and the contour at half-maximum of the reconstruction is the blue line. (a) Full width at half maximum (FWHM) is defined as the maximum separation between any two points above half maximum in the reconstruction (red arrows). This is a lower bound on the diameter of a circle needed to enclose the reconstruction (red circle). (b) Localization error is the separation of the known target position and the centroid of the reconstruction (red arrows). (c) Effective resolution is the diameter of a circle centered at the known target position needed to enclose all points above half maximum in the reconstruction (red circle and arrows). (Color online only.)
Figure 3
Figure 3
Representative image performance of sparse and high-density arrays. Targets are shown as red and blue squares. Half-maximum contours of the reconstructed responses are shown with the appropriately colored lines. (a) to (c) Here, two targets have been placed 4 mm apart adjacent to the horizontal midline of the arrays. The high-density array can correctly place the responses with a relatively small PSF (separation 4.4 mm). However, the triangular sparse array artificially displaces the two reconstructions (separation 23.2 mm) and enlarges the PSFs. The square sparse array results in reconstructions with an L-shape, which gives a large activation size, but reasonably close placement of the centroids (separation 11.5 mm). (d) to (f) Here, two targets have been placed far apart. Although the triangular sparse array reconstructs them as superimposed (separation between centroids of only 0.6 mm), the high-density array correctly separates them (17.5 mm). The square sparse array again reconstructs one of the activations in an L-shape, resulting in intermediate separation values (8.2 mm) with a large response size. (Color online only.)
Figure 4
Figure 4
Image quality metrics for the point-spread functions of targets placed at every location in sparse and high-density grids. (a) to (c) Full width at half maximum of the imaging arrays. The FWHM was defined as the maximum separation of all pairs of points above half maximum contrast. For the sparse arrays, there is overall poor resolution (high FWHM) with worse resolution along lines of symmetry in the grid geometry. Also, note that the triangular array has the worst resolution directly beneath the source line, where the system cannot constrain the activation vertically. The resolution for the high-density array is high across the entire imaging domain with little variation. (d) to (f) Localization error of the imaging arrays. The localization error was defined as the separation between the known target location and the centroid of the voxels reconstructed above half-maximum contrast. While the sparse arrays have low localization error directly under measurements and along points of symmetry, between measurements, it is high. Localization error for the high-density array is uniformly low across the entire field of view. (g) to (i) Effective resolution of imaging arrays. The effective resolution was defined as the diameter of the circle centered at each target position needed to enclose the response. The sparse arrays have poor effective resolution between the measurements, and only good effective resolution directly between adjacent sources and detectors. Effective resolution for the high-density array is good across the entire imaging domain, with little variation.
Figure 5
Figure 5
Simulations of activations similar to those from phase-encoded mapping of visual angle. The stimulus is of 1-cm radius and moves in an elliptical pattern, with the center of the ellipse displaced from the center of the field of view. There are a total of 36 activations in the entire rotation series. (a) to (c) Three equally spaced frames from the sequence of targets. (d) to (f) These three activations are reconstructed with the square sparse array. The activations are displaced to the nearest measurement location. (h) to (j) Reconstructions using the triangular sparse array. The activations are located correctly horizontally, but displaced to the same vertical location. (k) to (m) Reconstructions using the high-density array. Activations are correctly placed with the correct size. (n) Legend defining the phase of the target phase-encoded stimulus. (o)The phase of each pixel’s activation at the rotation frequency using the square sparse array. This measure gives the delay between the start of the stimulus and the maximum activation of each pixel. Areas with gray have low signal-to-noise and are discarded. The square sparse array is able to correctly reconstruct the pinwheel of phase from the original stimulus, with some lobes of abnormal phases near the edges and an asymmetric shape. (p) Phase-encoded mapping using the triangular sparse array. Vertical gradients have been incorrectly reconstructed as horizontal, and some phases have been placed in the incorrect quadrant. (q) Phase mapping with the high-density array, which correctly locates all phases in the pinwheel.
Figure 6
Figure 6
Simulations of activations similar to those from phase-encoded mapping of eccentricity. The stimulus is two 1.4-cm-tall rectangles moving upward in the field of view. There are a total of 18 activations in the entire rotation series. (a) to (c) Three equally spaced frames from the sequence of targets. (d) to (f) These three activations are reconstructed with the square sparse array. The activations are displaced to the nearest measurement location, often resulting in squeezing in the horizontal direction. (h) to (j) Reconstructions using the triangular sparse array. Activations under the source planes are unconstrained vertically due to the pad’s symmetry. (k) to (m) Reconstructions using the high-density array. Activations are correctly placed with the correct size. (n) Legend defining the phase of the target phase-encoded stimulus. (o) The phase of each pixel’s activation at the rotation frequency using the square sparse array. The square sparse array is able to find the general trend of increasing phase vertically, but with many artifacts in shape. (p) Phase-encoded mapping using the triangular sparse array. Due to the inability to vertically localize activations, the array can only define two general regions of phase, and it converts gradients that should be vertical to be horizontal. (q) Phase mapping with the high-density array, which correctly locates all phases in the target.
Figure 7
Figure 7
In vivo measurement from a phase-encoded mapping study of visual angle. The stimulus is a counterclockwise rotating, counterphase flickering wedge. There are a total of 36 activations in the entire rotation series. In order to line up stimuli and activations, we used our measured 6-s neurovascular lag. (a) and (b) Two frames from the stimulus. (c) and (d) Activations from these stimuli reconstructed with the triangular sparse array. Note the poor localization and strange activation shapes. (e) and (f) Reconstructions using the high-density array. Activations are correctly placed with reasonable sizes. (g) Legend defining the phase of the target phase-encoded stimulus. Note the 180-deg shift from Fig. 5n due to the transfer from visual field to cortex. (h) The phase of each pixel’s activation at the rotation frequency using the triangular sparse array. Note the ability to reconstruct a pinwheel of phase. The errors are similar to those from the simulation in Fig. 5p. (i) Phase mapping with the high-density array, which correctly locates all phases.
Figure 8
Figure 8
In vivo measurement from a phase-encoded mapping study of visual eccentricity. The stimulus is an expanding counterphase flickering ring. There are a total of 36 activations in the entire rotation series. In order to line up stimuli and activations, we used our measured 6-s neurovascular lag. (a) and (b) Two frames from the stimulus. (c) and (d) Activations from these stimuli reconstructed with the triangular sparse array. Note the poor localization, especially when the activation passes beneath the source line, and the inability to always locate activations in both hemispheres. (e) and (f) Reconstructions using the high-density array. Activations are correctly placed with reasonable sizes. (g) Legend defining the phase of the target phase-encoded stimulus. (h) The phase of each pixel’s activation at the rotation frequency using the triangular sparse array. Note the ability to distinguish only two regions, and the conversion of vertical gradients into horizontal gradients, similar to Fig. 6p. (i) Phase mapping with the high-density array, which correctly locates all phases.
Video 1
Video 1
Point-spread functions of targets placed at every location in the field of view for the sparse and high-density grids. (upper left) Simulated targets (2 mm×2 mm×10 mm) to be measured and reconstructed by the different arrays. (lower left) The response reconstructed with the high-density array. Note that the response tracks the movement of the target and that there is minimal blurring. (upper right) The response reconstructed with the square sparse array. The response jumps to the high sensitivity underneath the nearest source-detector pair, causing mislocalization and large response sizes. (lower right) The response reconstructed with the triangular sparse array. While the array can localize the target well horizontally, it has only two major positions vertically (MPEG, 19 MB). .
Video 2
Video 2
Simulations of activations similar to those from phase-encoded mapping of visual angle. The stimulus is of 1 cm radius and moves in an elliptical pattern, with the center of the ellipse displaced from the center of the field of view. There are a total of 36 activations in the entire rotation series. (upper left) The video of 36 targets. (lower left) Reconstructions using the high-density array. Activations are correctly placed with the correct size. (upper right) Activations reconstructed with the square sparse array. The activations are displaced to the nearest measurement location. (lower right) Reconstructions using the triangular sparse array. The activations are located correctly horizontally but jump from above the source line to below it (MPEG, 1 MB). .
Video 3
Video 3
Simulations of activations similar to those from phase-encoded mapping of eccentricity. The stimulus is two 1.4-cm-tall rectangles moving upward in the field of view. There are a total of 18 activations in the entire rotation series. (upper left) The video of 18 targets. (lower left) Reconstructions using the high-density array. Activations are correctly placed with the correct size. (upper right) Activations reconstructed with the square sparse array. The activations are displaced to the nearest measurement location, often resulting in squeezing in the horizontal direction. (lower right) Reconstructions using the triangular sparse array. Activations under the source planes are unconstrained vertically due to the pad’s symmetry (MPEG, 1 MB). .
Video 4
Video 4
In vivo measurement from a phase-encoded mapping study of visual angle. (left) The stimulus is a counterclockwise rotating, counterphase flickering wedge. There are a total of 36 activations in the entire rotation series. In order to line up stimuli and activations, we used our measured 6-s neurovascular lag. Here, the stimulus is shown without flicker and at 10× actual presentation speed. (upper right) Activations from these stimuli reconstructed with the triangular sparse array. Note the poor localization (especially in the lower half of the field of view) and strange activation shapes. (lower right) Reconstructions using the high-density array. Activations are correctly placed with reasonable sizes. The videos have been thresholded such that changes in hemoglobin concentration below baseline are not shown (MPEG, 1 MB). .
Video 5
Video 5
In vivo measurement from a phase-encoded mapping study of visual eccentricity. (left) The stimulus is an expanding counterphase flickering ring. There are a total of 36 activations in the entire rotation series. In order to line up stimuli and activations, we used our measured 6-s neurovascular lag. Here, the stimulus is shown without flicker and at 10× actual presentation speed. (upper right) Activations from these stimuli reconstructed with the triangular sparse array. Note the poor localization, especially when the activation passes beneath the source line, and the inability to always locate activations in both hemispheres. (lower right) Reconstructions using the high-density array. Activations are correctly placed with reasonable sizes. The movies have been thresholded such that changes in hemoglobin concentration below baseline are not shown (MPEG, 1 MB). .

References

    1. Boas D. A., Chen K., Grebert D., and Franceschini M. A., “Improving the diffuse optical imaging spatial resolution of the cerebral hemodynamic response to brain activation in humans,” Opt. Lett. OPLEDP 29(13), 1506–1508 (2004).10.1364/OL.29.001506 - DOI - PubMed
    1. Joseph D. K., Huppert T. J., Franceschini M. A., and Boas D. A., “Diffuse optical tomography system to image brain activation with improved spatial resolution and validation with functional magnetic resonance imaging,” Appl. Opt. APOPAI 45(31), 8142–8151 (2006).10.1364/AO.45.008142 - DOI - PubMed
    1. Heiskala J., Hiltunen P., and Nissila I., “Significance of background optical properties, time-resolved information and optode arrangement in diffuse optical imaging of term neonates,” Phys. Med. Biol. PHMBA7 54, 535–554 (2009).10.1088/0031-9155/54/3/005 - DOI - PubMed
    1. Tian F., Alexandrakis G., and Liu H., “Optimization of probe geometry for diffuse optical brain imaging based on measurement density and distribution,” Appl. Opt. APOPAI 48(13), 2496–2504 (2009).10.1364/AO.48.002496 - DOI - PMC - PubMed
    1. Zeff B. W., White B. R., Dehghani H., Schlaggar B. L., and Culver J. P., “Retinotopic mapping of adult human visual cortex with high-density diffuse optical tomography,” Proc. Natl. Acad. Sci. U.S.A. PNASA6 104(29), 12169–12174 (2007).10.1073/pnas.0611266104 - DOI - PMC - PubMed

Publication types

MeSH terms