. 2010 Mar-Apr;15(2):026011.
doi: 10.1117/1.3369811.

High-resolution wide-field imaging of retinal and choroidal blood perfusion with optical microangiography

Affiliations

High-resolution wide-field imaging of retinal and choroidal blood perfusion with optical microangiography

Lin An et al. J Biomed Opt. 2010 Mar-Apr.

Abstract

We present high-resolution wide-field imaging of retinal and choroidal blood perfusion with optical microangiography (OMAG) technology. Based on spatial frequency analysis, OMAG is capable of visualizing the vascular perfusion map down to capillary-level resolution. An OMAG system operating at 840 nm is used with an A-scan rate of 27,000 Hz, axial resolution of 8 mum, and sensitivity of 98 dB. To achieve wide-field imaging, we capture 16 optical coherence tomography (OCT) 3-D datasets in a sequential order, which together provide an area of approximately 7.4 x 7.4 mm(2) at the posterior segment of the human eye. For each of these datasets, the bulk tissue motion artifacts are eliminated by applying a phase compensation method based on histogram estimation of bulk motion phases, while the displacements occurring between adjacent B-frames are compensated for by 2-D cross correlation between two adjacent OMAG flow images. The depth-resolved capability of OMAG imaging also provides volumetric information on the ocular circulations. Finally, we compare the clinical fluorescein angiography and indocyanine green angiography imaging results with the OMAG results of blood perfusion map within the retina and choroid, and show excellent agreement between these modalities.


Figures

Figure 1
Figure 1
Schematic of OMAG system used to achieve wide field of view fundus blood vessel map: PC, polarization controller; and CCD, the charged couple device. The aiming source is a blue light source used for minimizing eye movement during the experiment progress. (Color online only.)
Figure 2
Figure 2
Scanning protocol to achieve wide field of view fundus blood vessel image. Numbers on the subareas refer to the order they are acquired. Background image is the OCT fundus image of one OCT volume (∼9×9 mm).
Figure 3
Figure 3
OMAG image results with and without phase compensation. (a) Conventional cross section OCT structural image. (b) 2-D OMAG flow image without phase compensation. (c) 2-D OMAG flow image with average bulk motion phase estimation for phase compensation.
Figure 4
Figure 4
Phase compensation results based on the histogram method. (a) PRDOCT phase difference map. (b) Histogram of bulk motion phase estimations without averaging. (c) Histogram after averaging. (d) OMAG flow image after phase compensation.
Figure 5
Figure 5
Cross correlation results of FDOCT structure image and OMAG flow image. (a) Typical FDOCT B-scan structure image. (b) Cross-correlation function between two lines at the same depth position [marked by the red line in (a)] between the adjacent B-scans. (c) Typical OMAG B-scan flow image. (d) Cross correlation function between two lines at the same depth position [marked by the red line in (c)] between the adjacent B-scans. (Color online only.)
Figure 6
Figure 6
x-y OMAG fundus flow image obtained from one OCT 3-D dataset (a) before and (b) after lateral displacement compensation. FDOCT elevational cross sectional structural image at the position marked as red line in the upper panel (c) before and (d) after axial displacement between B-scans is compensated. (Color online only.)
Figure 7
Figure 7
Segmentation of retina and choroid. (a) A typical OCT structure image and (b) the corresponding OMAG flow image. The red, yellow, green, and blue curves correspond to the anterior boundary of retina, posterior boundary of retina, anterior boundary of choroid, and posterior boundary of choroids, respectively. (Color online only.)
Figure 8
Figure 8
OMAG blood perfusion results for (a) retina and (b) choroid before motion compensation; and corresponding (c) retina and (d) choroid after motion compensation.
Figure 9
Figure 9
Volumetric image of blood vessel networks in (a) retina and (b) choroid. (c) Combined volumetric image, together with a cross section structure image.
Figure 10
Figure 10
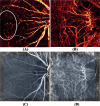
Wide field of view blood perfusion maps for (a) retina and (b) choroids, compared with (c) fluorescein angiography and (d) indocyanine green angiography. (Color online only.)

Similar articles

Cited by

References

    1. Kwiterovich K. A., Maguire M. G., Murphy R. P., Schachat A. P., Bressler N. M., Bressler S. B., and Fine S. L., “Frequency of adverse systemic reactions after fluorescein angiography. Results of a prospective study,” Ophthalmology OPHTDG 98, 1139–1142 (1991). - PubMed
    1. Hope-Ross M., Yannuzzi L., Gragoudas E., Guyer D., Slakter J., Sorenson J., Krupsky S., Orlock D., and Puliafito C., “Adverse reactions due to indocyanine green,” Ophthalmology OPHTDG 101, 529–533 (1994). - PubMed
    1. Fercher A. F., Drexler W., Hitzenberger C. K., and Lasser T., “Optical coherence tomography—principles and applications,” Rep. Prog. Phys. RPPHAG 66, 239–303 (2003).10.1088/0034-4885/66/2/204 - DOI
    1. Tomlins P. H. and Wang R. K., “Theory, development and applications of optical coherence tomography,” J. Phys. D Appl. Phys. 38, 2519–2535 (2005).10.1088/0022-3727/38/15/002 - DOI
    1. Chen Z. P., Milner T. E., Srinivas S., Wang X., Malekafzali A., van Gemert M. J. C., and Nelson J. S., “Noninvasive imaging of in vivo blood flow velocity using optical Doppler tomography,” Opt. Lett. OPLEDP 22(14), 1119–1121 (1997).10.1364/OL.22.001119 - DOI - PubMed

Publication types

MeSH terms