. 2010 Mar-Apr;15(2):026020.
doi: 10.1117/1.3381184.

Second harmonic generation imaging as a potential tool for staging pregnancy and predicting preterm birth

Affiliations

Second harmonic generation imaging as a potential tool for staging pregnancy and predicting preterm birth

Meredith L Akins et al. J Biomed Opt. 2010 Mar-Apr.

Erratum in

  • J Biomed Opt. 2010 May-Jun;15(3):039802

Abstract

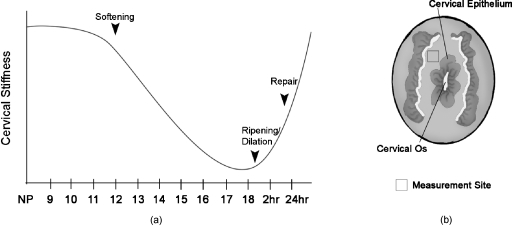
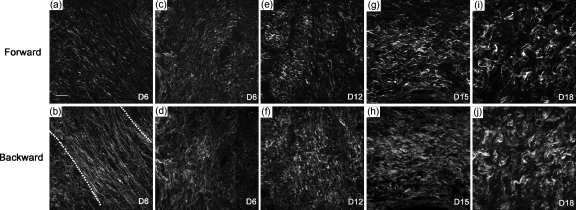
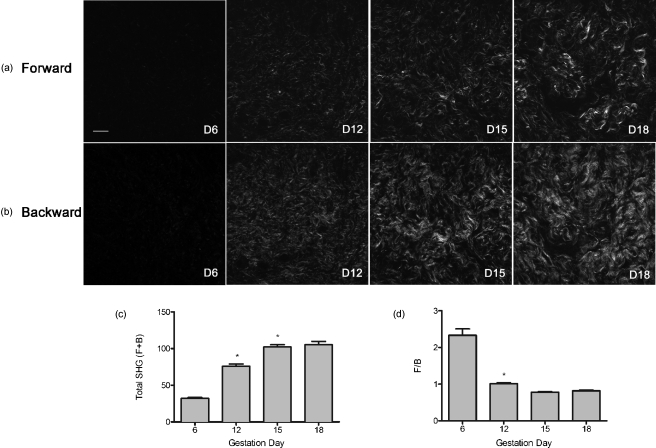
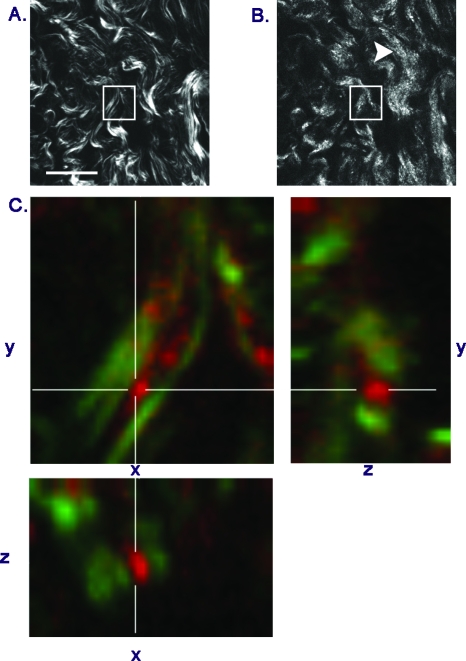
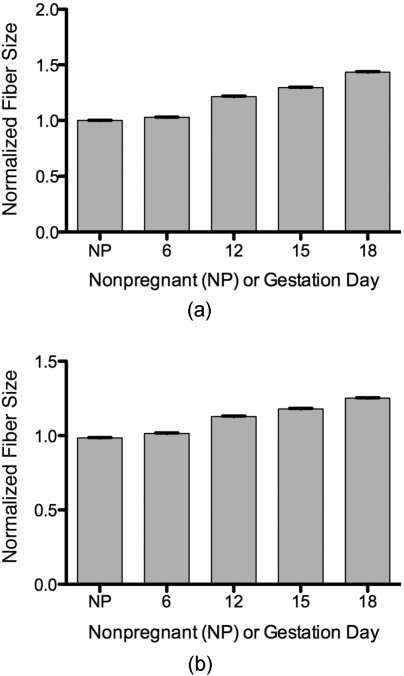
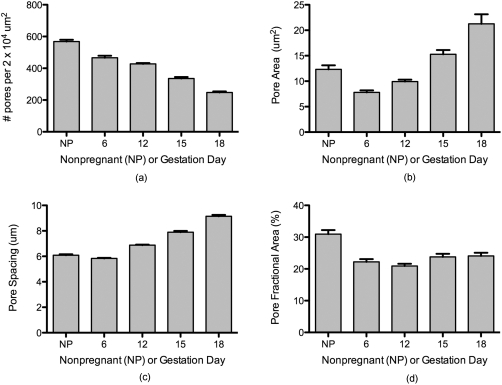
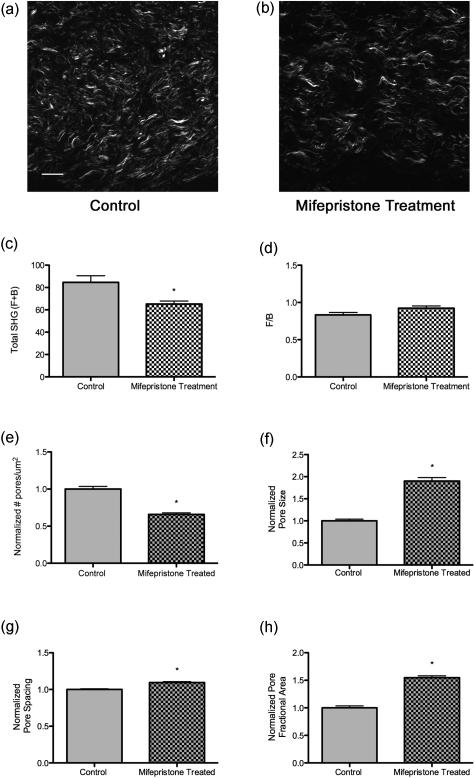
We use second harmonic generation (SHG) microscopy to assess changes in collagen structure of murine cervix during cervical remodeling of normal pregnancy and in a preterm birth model. Visual inspection of SHG images revealed substantial changes in collagen morphology throughout normal gestation. SHG images collected in both the forward and backward directions were analyzed quantitatively for changes in overall mean intensity, forward to backward intensity ratio, collagen fiber size, and porosity. Changes in mean SHG intensity and intensity ratio take place in early pregnancy, suggesting that submicroscopic changes in collagen fibril size and arrangement occur before macroscopic changes become evident. Fiber size progressively increased from early to late pregnancy, while pores between collagen fibers became larger and farther apart. Analysis of collagen features in premature cervical remodeling show that changes in collagen structure are dissimilar from normal remodeling. The ability to quantify multiple morphological features of collagen that characterize normal cervical remodeling and distinguish abnormal remodeling in preterm birth models supports future studies aimed at development of SHG endoscopic devices for clinical assessment of collagen changes during pregnancy in women and for predicting risk of preterm labor which occurs in 12.5% of all pregnancies.


Figures

Figure 1
Figure 1
(a) Schematic diagram of changes in cervical compliance through mouse pregnancy. Changes in the biomechanical properties of the cervix, described as cervical stiffness, can first be measured on gestation day 12 in the early phase of remodeling, referred to as softening. Thereafter, there is a progressive decline in stiffness, reaching a minimum during ripening and dilation. After birth, the tensile strength of the tissue rapidly returns to a nonpregnant (NP) state. NP, 9–18 refer to day of pregnancy and 2 and 24 h refer to hours postpartum. (b) Illustration of sample orientation for SHG detection. Cervices were dissected, frozen in OCT medium, and sectioned transversely in 50-μm increments. SHG image Z-stacks were collected from each section in a cervical stroma region adjacent to cervical Os as indicated by box.
Figure 2
Figure 2
SHG signal of collagen reveals dramatic changes in collagen morphology. Images were taken from gestation days: (a–d) 6, (e–f) 12, (g–h) 15, (i–j) 18 cervices in both (a,c,e,g,i) forward and (b,d,f,h,j) backward directions. (a) and (b) show an example of a portion of the circumferential band of fibers prominent in samples from days 6 and 12 [demarcated by dotted lines, (b)]. (c) and (d) show a region closer to the cervical lumen where the fibers appear more randomly oriented. In general, collagen fibers appear thicker and more kinked as gestation progresses. Brightness and contrast for each panel were manipulated individually for optimal visualization of morphology at each time point. Scale bar represents 25 μm.
Figure 3
Figure 3
Absolute SHG signal intensity changes during pregnancy. Representative (a) forward and (b) backward SHG images taken at gestation days 6, 12, 15, and 18 using identical image acquisition parameters. Brightness and contrast adjustments were identical for all panels shown in (a) and (b) to preserve intensity relationships between the forward and backward channels and between time points. (c,d) Quantitative comparison of signal intensity: Total SHG intensity (F+B) increases from day 6 to day 15 (c). F∕B ratio decreases more than twofold from day 6 to day 12 and then remains constant for the remainder of gestation (d). ∗ Difference from a previous time point is statistically significant with P<0.0001. Error bars represent standard error of the mean of 20 images. n=2 animals for each time point. Scale bar represents 25 μm.
Figure 4
Figure 4
Punctate features in the back-scattered images are abundant at later stages of gestation. (a) Forward image of d18 cervix. (b) Backward image of same field of view. Arrowhead denotes a large cluster of punctae not visible in the forward image. (c) xy, xz, and yz maximum intensity projections of the region inside the box show that punctae in the backward image (red), align adjacent to filaments visible in the forward direction (green), and are not cross sections of long filaments extending along the optic axis. Scale bar reprents 25 μm.
Figure 5
Figure 5
Fiber size increases with the progression of pregnancy. Fiber size was measured from (a) forward and (b) backward images and normalized to the value for nonpregnant samples (NP). Differences between all time points are statistically significant with P<0.0001. Bars represent the mean value of measurements from images of transverse sections collected throughout the longitudinal extent of the cervix. Error bars represent standard error of the mean of 94 (NP), 133 (d6), 134 (d12), 91 (d15), and 126 (d18) images. n=2 animals for NP; n=3 animals for pregnant time points.
Figure 6
Figure 6
Evaluation of changes in spaces (pores) between collagen fibers. SHG images collected in the forward direction were evaluated for (a) the number of pores (b) pore size, (c) distance between pores, and (d) pore fractional area. Pore number declined significantly at each timepoint with P<0.0001. Pore size declined significantly between nonpregnant and day 6 samples and then increased progressively throughout gestation, becoming significant between days 12 and 15 (P<0.0001). Pore-to-pore spacing increased significantly beginning at day 12 (P<0.0001). Pore fractional area decreased by day 6 and showed no significant change thereafter (P<0.0001). Bars represent the mean of measurements from images of transverse sections collected throughout the longitudinal extent of the cervix. Error bars represent standard error of the mean of 94 (NP), 133 (d6), 134 (d12), 91 (d15), and 126 (d18) images. n=2 animals for NP; n=3 animals for pregnant time points.
Figure 7
Figure 7
Changes in collagen structure with mifepristone treatment do not mimic normal cervical ripening. Visual inspection of images from (a) vehicle- or (b) mifepristone-treated samples reveals a change in spacing between collagen fibers. Quantitative measurement of (c) total signal intensity (F+B) and (d) F∕B ratio reveals a decline in SHG intensity in samples from treated animals compared to untreated controls [(c) P=0.0064, (d) P=0.0038]. The number of pores per unit area in cervices from treated animals is decreased relative to the vehicle control [(e) P=0.001]. Pores are significantly larger in size [(f) P<0.0001] and spaced farther apart [(g) P<0.0001]. Pore fractional area increases significantly upon treatment [(h) P<0.0001]. Bars represent the mean of measurements from images of transverse sections collected throughout the longitudinal extent of the cervix. Error bars represent standard error of the mean of 62 images for control and 52 images for treatment. n=4 animals∕treatment group. Scale bar represents 25 um.

Similar articles

Cited by

References

    1. Committee on Understanding Premature Birth and Assuring Healthy Outcomes (Ed. Board on Health Sciences Policy), National Academies Press, Washington, DC (2006).
    1. Leppert P. C., “Anatomy and physiology of cervical ripening,” Clin. Obstet. Gynecol. COGYAK 38, 267–279 (1995).10.1097/00003081-199506000-00009 - DOI - PubMed
    1. Read C. P., Word R. A., Ruscheinsky M. A., Timmons B. C., and Mahendroo M. S., “Cervical remodeling during pregnancy and parturition: molecular characterization of the softening phase in mice,” Reproduction 134, 327–340 (2007).10.1530/REP-07-0032 - DOI - PubMed
    1. Word R. A., “Dynamics of cervical remodeling during pregnancy and parturition: mechanisms and current concepts,” Semin. Reprod. Med. 25, 69–79 (2007).10.1055/s-2006-956777 - DOI - PubMed
    1. Mahendroo M., Porter A., Russel D., and Word R. A., “The parturition defect in steroid 5a-reductase type 1 knockout mice is due to impaired cervical ripening,” Mol. Endocrinol. MOENEN 13(6), 981–992 (1999).10.1210/me.13.6.981 - DOI - PubMed

Publication types

Substances