. 2010 Mar-Apr;15(2):027008.
doi: 10.1117/1.3374049.

Intraoperative delineation of primary brain tumors using time-resolved fluorescence spectroscopy

Affiliations

Intraoperative delineation of primary brain tumors using time-resolved fluorescence spectroscopy

Pramod V Butte et al. J Biomed Opt. 2010 Mar-Apr.

Abstract

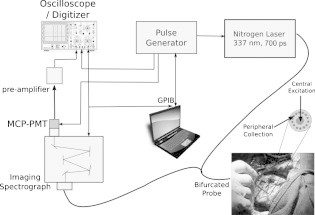
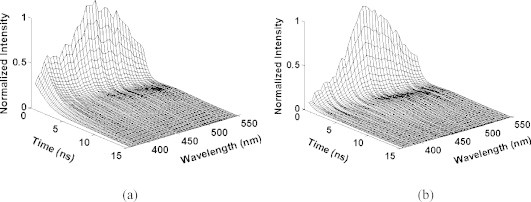
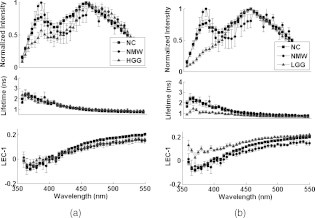
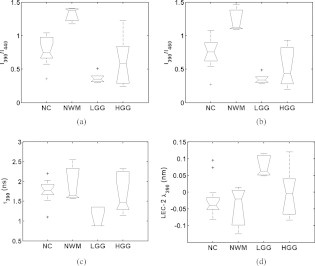
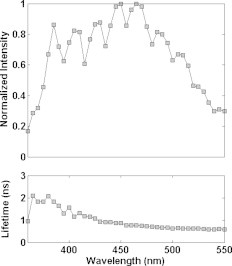
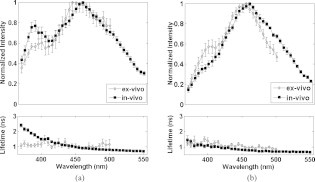
The goal of this study is to determine the potential of time-resolved laser-induced fluorescence spectroscopy (TR-LIFS) as an adjunctive tool for delineation of brain tumor from surrounding normal tissue in order to assist the neurosurgeon in near-complete tumor excision. A time-domain TR-LIFS prototype apparatus (gated photomultiplier detection, fast digitizer) was used for recording tissue autofluorescence in normal cortex (NC), normal white matter (NWM), and various grades of gliomas intraoperatively. Tissue fluorescence was induced with a pulsed nitrogen laser (337 nm, 700 ps), and the intensity decay profiles were recorded in the 360- to 550-nm spectral range (10-nm interval). Histopathological analysis (hematoxylin & eosin) of the biopsy samples taken from the site of TR-LIFS measurements was used for validation of spectroscopic results. Preliminary results on 17 patients demonstrate that normal cortex (N=16) and normal white matter (N=3) show two peaks of fluorescence emission at 390 nm (lifetime=1.8+/-0.3 ns) and 460 nm (lifetime=0.8+/-0.1 ns). The 390-nm emission peak is absent in low-grade glioma (N=5; lifetime=1.1 ns) and reduced in high-grade glioma (N=9; lifetime=1.7+/-0.4 ns). The emission characteristics at 460 nm in all tissues correlated with the nicotinamide adenine dinucleotide fluorescence (peak: 440 to 460 nm; lifetime: 0.8 to 1.0 ns). These findings demonstrate the potential of using TR-LIFS as a tool for enhanced delineation of brain tumors during surgery. In addition, this study evaluates similarities and differences between TR-LIFS signatures of brain tumors obtained in vivo and those previously reported in ex vivo brain tumor specimens.


Figures

Figure 1
Figure 1
Schematic of the pulse-sampling TR-LIFS apparatus, including a fast digitizer and gated detection used for the in vivo evaluation of brain tumor time-resolved fluorescence emission. Photo shows the tip of the optical probe used on the brain tissue (cortex of a patient undergoing brain tumor surgery).
Figure 2
Figure 2
Typical fluorescence impulse response function (FIRF) from (a) normal cortex and (b) low-grade glioma after deconvolving the laser signal using the Laguerre deconvolution technique.
Figure 3
Figure 3
Fluorescence emission spectra (top), average lifetimes (middle), and Laguerre coefficients (LEC-1) (bottom) across the emission wavelengths for distinct brain tissue types. (a) Normal cortex (NC), normal white matter (NWM), and high-grade glioma (HGG). (b) Normal cortex, normal white matter and low-grade glioma (LGG). Note: The average lifetimes of the LGG is relatively constant across the wavelength compared to the average lifetimes of NC, NWM, and HGG.
Figure 4
Figure 4
Representative examples of spectroscopic parameters (mean±SE) that allows for the differentiation of distinct tissue types (a) Intensity ratio 390nm versus 440nm; (b) intensity ratio 390 versus 460; (c) average lifetime at 390nm; and (d) Laguerre coefficients at 390nm. (NC=normal cortex; NWM=normal white matter; HGG=high-grade glioma; LGG=low-Grade glioma.) Note: LGG demonstrates low variance as compared with high-grade glioma and can be readily distinguished from normal brain tissue. On each box, the central mark is the median, the edges of the box are the 25th and 75th percentiles, the whiskers extend to the most extreme data points not considered outliers, and outliers are plotted individually.
Figure 5
Figure 5
Example of the fluorescence emission spectrum (intensity values at distinct wavelengths) modulated by the movement of the brain due to breathing. The changes in intensity are due to changes in the excitation-collection during the approximately 30-s data recording (wavelength scanning) time. The figure depicts the variability in fluorescence emission spectrum from NC tissue due to movement of the brain (top). Note: The average lifetime (bottom) from the same tissue samples is not affected by such movements.
Figure 6
Figure 6
Group values (mean±SE) of a set of spectroscopic parameters derived from ex vivo and in vivo TR-LIFS measurements: normalized emission spectrum (top) and average lifetime along the emission wavelengths (bottom) of normal cortex, (a) Normal cortex; (b) low-grade glioma.

References

    1. Brandes A. A., Tosoni A., Franceschi E., Reni M., Gatta G., and Vecht C., “Glioblastoma in adults,” Crit. Rev. Oncol. Hematol. ZZZZZZ 67(2), 139–152 (2008).10.1016/j.critrevonc.2008.02.005 - DOI - PubMed
    1. Fazekas J. T., “Treatment of grades I and II brain astrocytomas. The role of radiotherapy,” Int. J. Radiat. Oncol., Biol., Phys. IOBPD3 2(7–8), 661–666 (1977). - PubMed
    1. Leibel S. A., Sheline G. E., Wara W. M., Boldrey E. B., and Nielsen S. L., “The role of radiation therapy in the treatment of astrocytomas,” Cancer ZZZZZZ 35(6), 1551–1557 (1975).10.1002/1097-0142(197506)35:6<1551::AID-CNCR2820350612>3.0.CO;2-V - DOI - PubMed
    1. Chung Y. G., Schwartz J. A., Gardner C. M., Sawaya R. E., and Jacques S. L., “Diagnostic potential of laser-induced autofluorescence emission in brain tissue,” J. Korean Med. Sci. JKMSEH 12(2), 135–142 (1997). - PMC - PubMed
    1. Croce A. C., Fiorani S., Locatelli D., Nano R., Ceroni M., Tancioni F., Giombelli E., Benericetti E., and Bottiroli G., “Diagnostic potential of autofluorescence for an assisted intraoperative delineation of glioblastoma resection margins,” Photochem. Photobiol. PHCBAP 77(3), 309–318 (2003).10.1562/0031-8655(2003)077<0309:DPOAFA>2.0.CO;2 - DOI - PubMed

Publication types

Substances