. 2010;11(5):R48.
doi: 10.1186/gb-2010-11-5-r48. Epub 2010 May 4.

The dissection of transcriptional modules regulated by various drugs of abuse in the mouse striatum

Affiliations

The dissection of transcriptional modules regulated by various drugs of abuse in the mouse striatum

Marcin Piechota et al. Genome Biol. 2010.

Abstract

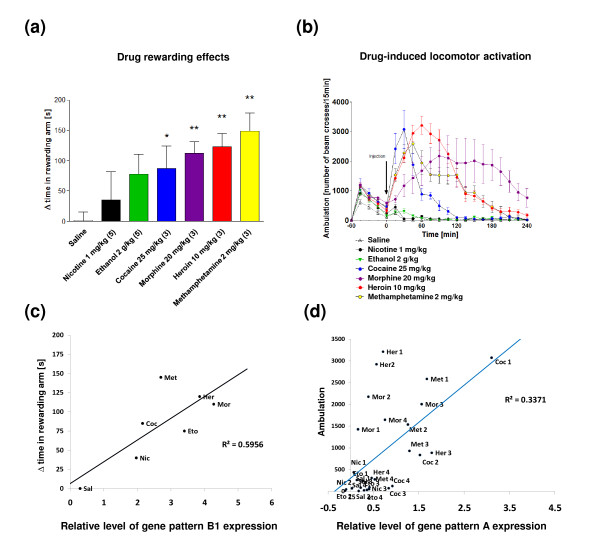
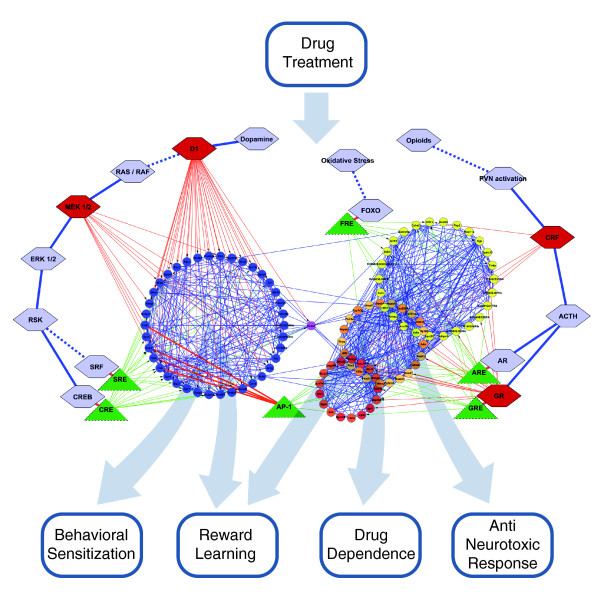
Background: Various drugs of abuse activate intracellular pathways in the brain reward system. These pathways regulate the expression of genes that are essential to the development of addiction. To reveal genes common and distinct for different classes of drugs of abuse, we compared the effects of nicotine, ethanol, cocaine, morphine, heroin and methamphetamine on gene expression profiles in the mouse striatum.

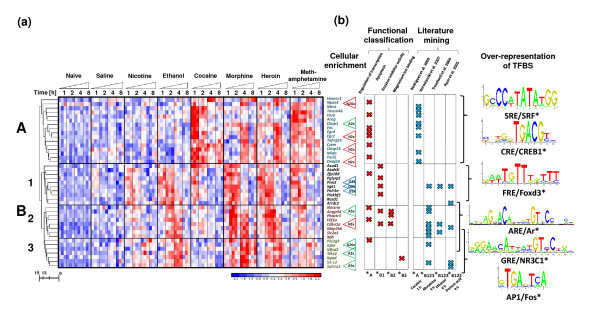
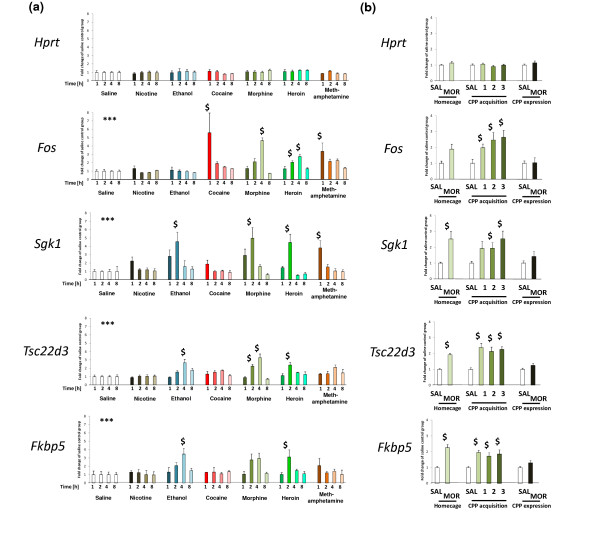
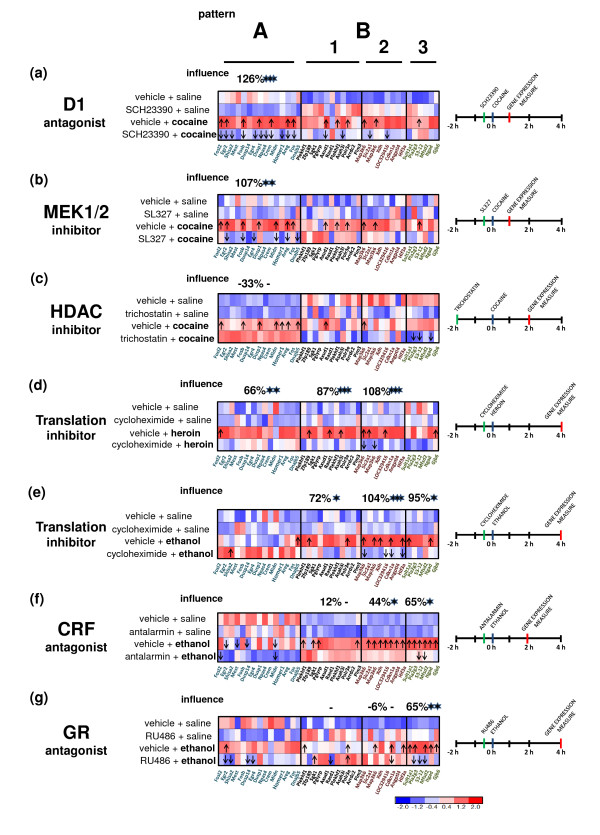
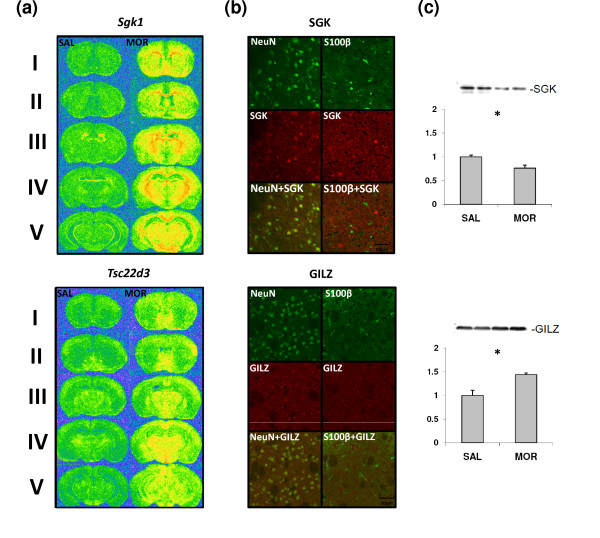
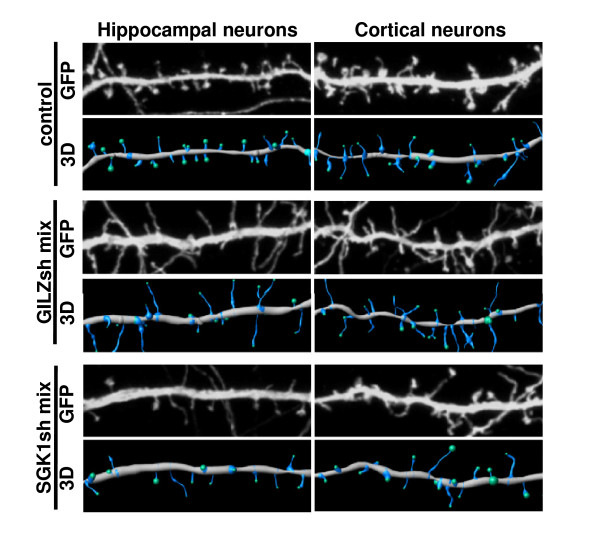
Results: We applied whole-genome microarray profiling to evaluate detailed time-courses (1, 2, 4 and 8 hours) of transcriptome alterations following acute drug administration in mice. We identified 42 drug-responsive genes that were segregated into two main transcriptional modules. The first module consisted of activity-dependent transcripts (including Fos and Npas4), which are induced by psychostimulants and opioids. The second group of genes (including Fkbp5 and S3-12), which are controlled, in part, by the release of steroid hormones, was strongly activated by ethanol and opioids. Using pharmacological tools, we were able to inhibit the induction of particular modules of drug-related genomic profiles. We selected a subset of genes for validation by in situ hybridization and quantitative PCR. We also showed that knockdown of the drug-responsive genes Sgk1 and Tsc22d3 resulted in alterations to dendritic spines in mice, possibly reflecting an altered potential for plastic changes.

Conclusions: Our study identified modules of drug-induced genes that share functional relationships. These genes may play a critical role in the early stages of addiction.


Figures

Figure 1
Figure 1
Comparison of the reinforcing and activating effects of drugs of abuse in C57BL/6J mice. (a) Bar graph summarizing the development of CPP to morphine, heroin, ethanol, nicotine, methamphetamine, cocaine or saline injections (i.p.). The number of drug conditioning sessions is indicated in parentheses. The level of significance was measured using ANOVA following the Newman-Keuls post-hoc test for drug versus saline; *P < 0.05; **P < 0.01 (n = 6 to 12). (b) Graph summarizing locomotor activation in response to drug treatment measured as increased ambulation in an activity cage during 4 h (n = 5). (c,d) Analysis of correlations between drug-induced changes in gene expression and behavioral effects of drugs in mice (Additional file 9). Scatter plots present the most significant correlation between the behavioral effects (y-axis) and the level of drug-induced transcription (x-axis). Correlation with locomotor activation was computed using data for each particular time point.
Figure 2
Figure 2
Hierarchical clustering of drug-dependent transcriptional alterations in mouse striatum. (a) Microarray results are shown as a heat map and include genes with a genome-wide significance from two-way ANOVA of the drug factor. Colored rectangles represent transcript abundance (Additional file 2) 1, 2, 4 and 8 h after injection of the drug indicated above of the gene labeled on the right. The intensity of the color is proportional to the standardized values (between -2 and 2) from each microarray, as indicated on the bar below the heat map image. Clustering was performed using Euclidean distance according to the scale on the left. Major drug-responsive gene transcription patterns are arbitrarily described as 'A', 'B1', 'B2' and 'B3. (b) Gene cluster analysis using data-mining methods (Table 1). The fold cellular enrichment (2, 5 or 20 in a particular cell population, as reported in Cahoy et al. [101]) of the selected transcripts in various cell types is indicated by N (neurons), A (astrocytes) or O (oligodendrocytes). Over-representation of transcription factor binding site (TFBSs), as indicated on the left, was identified using the cREMaG database (see Materials and methods). The statistical significance of enrichment is marked as *P < 0.05.
Figure 3
Figure 3
Validation of drug-induced regulation of gene expression. (a) Bar graphs summarizing qPCR-based measurement of changes in selected gene expression after the indicated drug injection, presented as fold change over the saline control group with standard error (n = 5 to 6). Significant differences in the main effects from multivariate ANOVA for drug treatment are indicated by asterisks (***P < 0.001) and from the Bonferroni post-hoc test (versus appropriate saline control) by dollar signs (P < 0.05). (b) Bar graphs summarizing qPCR-based measurement of selected gene expression after morphine (MOR) injection in the home cage or during CPP acquisition and expression. Results are presented as fold change over the saline control group (SAL) with standard error (n = 6 to 7). Significant differences in transcript abundance between the morphine-treated and control animals obtained by a t-test are indicated by dollar signs (P < 0.05).
Figure 4
Figure 4
Pharmacological dissection of transcriptional networks from the drug-induced gene expression profile. Microarray results are shown as heat maps that include drug-responsive genes with genome-wide significance (Figure 2a). Colored rectangles represent transcript abundance and are labeled below the heat map. Each row contains the mean value from three independent array replicates, where samples from two mice were pooled and used for each microarray. The intensity of the color is proportional to the standardized values (between -2 and 2) from each microarray, as indicated on the bar below the cluster images. The names of enzyme inhibitors or receptor antagonists (inhibitor/antagonist) are indicated on the left. The time scheme of each experiment (a-g) is presented on the right. The arrow indicates (two-tailed t-test, P < 0.05) up- or down-regulation of the expression of a particular gene in comparisons between the drug plus vehicle and saline plus vehicle groups (upper row on each heat map) or drug plus inhibitor/antagonist and drug plus vehicle groups (bottom row). The overall influence was measured as a percentage of inhibition of the drug-induced transcriptional response, with 0% representing no effect and 100% representing complete inhibition. The statistical significance of influence was measured as a comparison of the mean fold change between the drug plus inhibitor/antagonist and saline plus vehicle versus drug plus vehicle and saline plus vehicle groups. The level of significance was measured using a two-tailed t-test: *P < 0.05; **P < 0.01; ***P < 0.001. CRF, corticotrophin-releasing factor; HDAC, histone deacetylase.
Figure 5
Figure 5
Brain and cellular distribution of two selected drug-regulated genes. (a) False-colored micrographs representing the relative level of the indicated mRNA 4 h after saline (SAL) or 20 mg/kg morphine (MOR) treatment revealed by in situ hybridization. Five coronal sections of mouse brain are presented, containing: (I) dorsal striatum and nucleus accumbens, (II) mid striatum, (III and IV) dorsal hippocampus and (V) ventral hippocampus/mesencephalon. (b) Confocal fluorescence micrographs showing coronal sections of striatum after immunohistochemical staining against SGK (Sgk1, red in the upper panel), GILZ (Tsc22d3, red in the lower panel), NeuN (neuronal marker, green, left) and S100B (glial marker, green, right). Scale bar: 50 μm. (c) Immunoblot of striatal lysates from mice 4 h after injection with morphine (MOR, 20 mg/kg i.p.) or saline (SAL) with antibodies against SGK and GILZ. The level of significance was measured using a two-tailed t-test: *P < 0.05. Error bars indicate standard error.
Figure 6
Figure 6
The effects of Tsc22d3 and Sgk1 knockdown on dendritic spine morphology in cultured primary neurons. Representative micrographs and three-dimensional Imaris reconstructions of dendritic segments of hippocampal and cortical neurons are presented. The neurons were transfected with pSUPER (control) or GILZsh mix or SGK1sh mix in pSUPER on day in vitro 14 for 3 days. GFP was used to highlight transfected cell morphology.
Figure 7
Figure 7
A proposed scheme of the core regulatory network of drug-induced molecular mechanisms and gene expression alterations in the striatum. Small nodes represent transcripts belonging to the identified gene expression patterns. The color of each node reflects its gene pattern membership: blue, A; yellow, B1; orange, B2; and red, B3. Thin blue edges between the nodes indicate a correlation between the expression profiles of two genes. Functional connections were implemented based on our results from literature mining, pharmacological experiments and in silico predictions of TFBSs. Large hexagonal nodes represent elements of drug-activated signaling pathways. Solid and dashed edges between the nodes indicate direct or indirect interactions, respectively, as suggested by the literature. A red node color and thin red edge indicate a pharmacologically verified connection (Figure 4). Green triangle nodes represent gene transcription regulatory elements. Thin green edges indicate positive detection of TFBSs in a promoter region of a particular gene. Transparent arrows suggest the influence of gene expression changes on addiction-related traits based on the correlations between the transcriptional and phenotypic response (Figure 1c, d; Additional file 9).

References

    1. Nutt D, King LA, Saulsbury W, Blakemore C. Development of a rational scale to assess the harm of drugs of potential misuse. Lancet. 2007;369:1047–1053. doi: 10.1016/S0140-6736(07)60464-4. - DOI - PubMed
    1. Nugent FS, Penick EC, Kauer JA. Opioids block long-term potentiation of inhibitory synapses. Nature. 2007;446:1086–1090. doi: 10.1038/nature05726. - DOI - PubMed
    1. Ungless MA, Whistler JL, Malenka RC, Bonci A. Single cocaine exposure in vivo induces long-term potentiation in dopamine neurons. Nature. 2001;411:583–587. doi: 10.1038/35079077. - DOI - PubMed
    1. Hyman SE, Malenka RC, Nestler EJ. Neural mechanisms of addiction: the role of reward-related learning and memory. Annu Rev Neurosci. 2006;29:565–598. doi: 10.1146/annurev.neuro.29.051605.113009. - DOI - PubMed
    1. Nguyen PV, Abel T, Kandel ER. Requirement of a critical period of transcription for induction of a late phase of LTP. Science. 1994;265:1104–1107. doi: 10.1126/science.8066450. - DOI - PubMed

Publication types

MeSH terms