. 2010;12(3):R25.
doi: 10.1186/bcr2568. Epub 2010 May 6.

High-resolution genomic and expression analyses of copy number alterations in HER2-amplified breast cancer

Affiliations

High-resolution genomic and expression analyses of copy number alterations in HER2-amplified breast cancer

Johan Staaf et al. Breast Cancer Res. 2010.

Abstract

Introduction: HER2 gene amplification and protein overexpression (HER2+) define a clinically challenging subgroup of breast cancer with variable prognosis and response to therapy. Although gene expression profiling has identified an ERBB2 molecular subtype of breast cancer, it is clear that HER2+ tumors reside in all molecular subtypes and represent a genomically and biologically heterogeneous group, needed to be further characterized in large sample sets.

Methods: Genome-wide DNA copy number profiling, using bacterial artificial chromosome (BAC) array comparative genomic hybridization (aCGH), and global gene expression profiling were performed on 200 and 87 HER2+ tumors, respectively. Genomic Identification of Significant Targets in Cancer (GISTIC) was used to identify significant copy number alterations (CNAs) in HER2+ tumors, which were related to a set of 554 non-HER2 amplified (HER2-) breast tumors. High-resolution oligonucleotide aCGH was used to delineate the 17q12-q21 region in high detail.

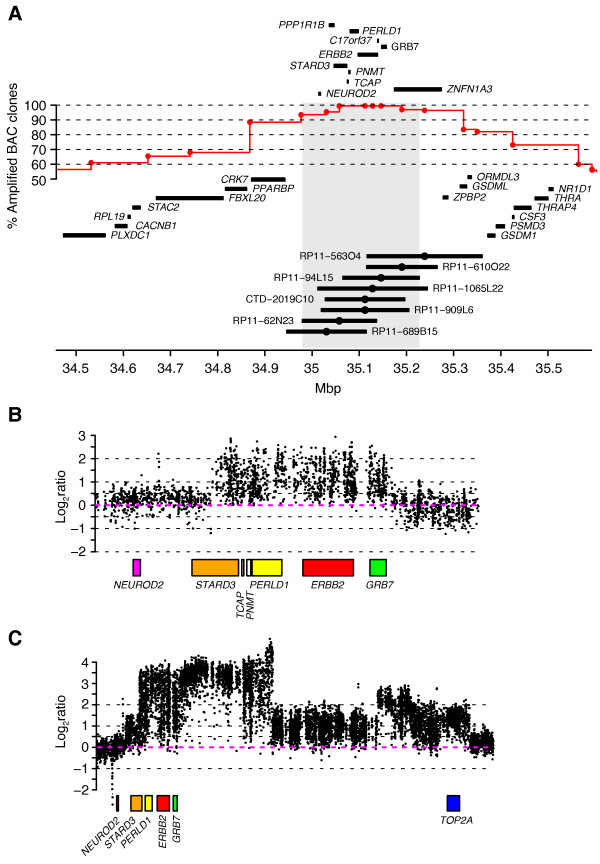
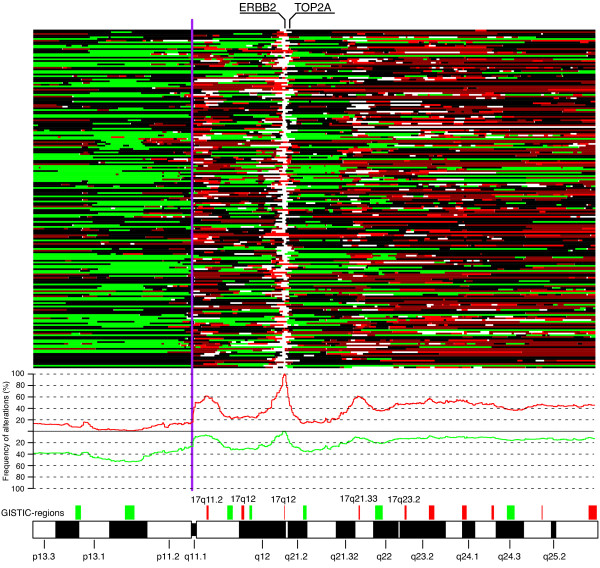
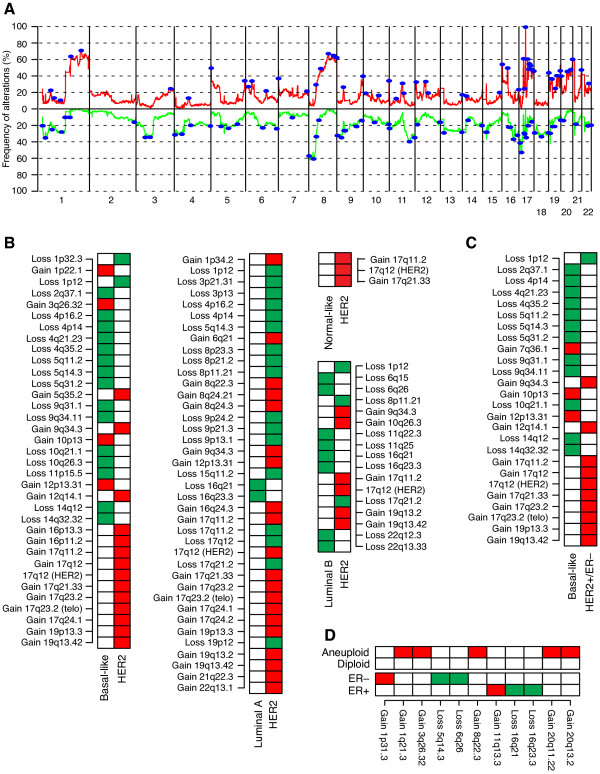
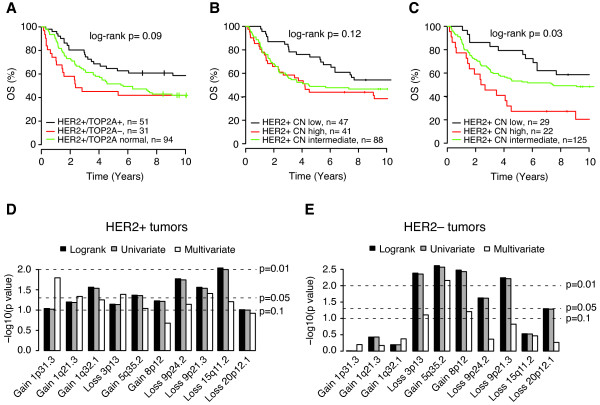
Results: The HER2-amplicon was narrowed to an 85.92 kbp region including the TCAP, PNMT, PERLD1, HER2, C17orf37 and GRB7 genes, and higher HER2 copy numbers indicated worse prognosis. In 31% of HER2+ tumors the amplicon extended to TOP2A, defining a subgroup of HER2+ breast cancer associated with estrogen receptor-positive status and with a trend of better survival than HER2+ breast cancers with deleted (18%) or neutral TOP2A (51%). HER2+ tumors were clearly distinguished from HER2- tumors by the presence of recurrent high-level amplifications and firestorm patterns on chromosome 17q. While there was no significant difference between HER2+ and HER2- tumors regarding the incidence of other recurrent high-level amplifications, differences in the co-amplification pattern were observed, as shown by the almost mutually exclusive occurrence of 8p12, 11q13 and 20q13 amplification in HER2+ tumors. GISTIC analysis identified 117 significant CNAs across all autosomes. Supervised analyses revealed: (1) significant CNAs separating HER2+ tumors stratified by clinical variables, and (2) CNAs separating HER2+ from HER2- tumors.

Conclusions: We have performed a comprehensive survey of CNAs in HER2+ breast tumors, pinpointing significant genomic alterations including both known and potentially novel therapeutic targets. Our analysis sheds further light on the genomically complex and heterogeneous nature of HER2+ tumors in relation to other subgroups of breast cancer.


Figures

Figure 1
Figure 1
Extent and pattern of the HER2-amplicon on chromosome 17q12-q21 in HER2+ BC. (A) Frequency of amplification across 200 HER2-amplified tumors analyzed by BAC aCGH. Frequency estimates correspond to number of tumors with segmented log2ratio >0.5 for respective BAC probe and are displayed at respective BAC probe's center position (red circles). Shortest region of amplification overlap (SRO) was defined from involved BAC probes genomic start and stop position and is marked with a light gray background. Genomic position of eight BAC probes mapping to the SRO is displayed together with their center position (black circle). (B) Close-up of chr17:35000001-35200000 (hg18 build) for tumor TAX577717 analyzed by zoom-in oligonucleotide aCGH. (C) Close-up of chr17:35000001-35867695 (hg18 build) for tumor TAX577700 analyzed by zoom-in aCGH.
Figure 2
Figure 2
Extent, frequency and patterns of CNAs on chromosome 17 in HER2+ BC. Regions of loss are shown in green, normal in black, gain in dark red, amplification in red, and high-level amplification in white for each sample (row). Frequency of gain (red) and loss (green) across all 200 tumors are shown for chromosome 17. Read boxes, above the cytoband bar, indicate GISTIC regions of gain and green boxes GISTIC regions of loss. GISTIC regions with recurrent amplifications that are more frequent in HER2+ BC compared to HER2- BC are named. Vertical purple line corresponds to centromer limit.
Figure 3
Figure 3
Pattern of co-occurrence of recurrent amplifications in HER2+ and HER2- BC. (A) Fraction of co-amplification of recurrent amplifications in HER2+ BC excluding the 17q12 HER2 locus. For each amplification (vertical axis), the fraction of samples with a co-amplification (horizontal axis) is indicated in each box. Only co-amplifications occurring in ≥2 tumors with fractions ≥0.2 are displayed. For example, 20% of tumors with 17q24.2 amplification also have 1q21.2 amplification, while 40% of tumors with 1q21.2 amplifications also show amplification at 17q24.2 indicating that the number of 1q21.2 amplified tumors is lower than the number of tumors with 17q24.2 amplification. (B) The fraction of co-amplification of recurrent amplifications in A in HER2- breast tumors. Only co-amplifications occurring in ≥3 tumors with fractions ≥0.2 are displayed. Fractions are calculated similarly as in A.
Figure 4
Figure 4
Significant CNAs in HER2+ BC in relation to molecular subtypes. (A) Frequency of gain (red) and loss (green) in 200 HER2+ tumors. Blue regions indicate significant CNAs identified by GISTIC analysis. (B) GISTIC regions differing HER2+ tumors from HER2- tumors classified according to the molecular subtypes as basal-like, luminal A, luminal B and normal-like (P < 0.05, Bonferroni adjusted Fisher's exact test). Each box represents a GISTIC region, red indicates more frequent gain, and green indicates more frequent loss. (C) GISTIC regions differing HER2+/ER- tumors from HER2- tumors classified as basal-like. Regions identified by Bonferroni adjusted Fisher's exact test (P < 0.05). Each box represents a GISTIC region, red indicates more frequent gain, and green indicates more frequent loss. (D) GISTIC regions associated with ER status and DNA ploidy in HER2+ BC. Regions identified by Student's t-test with FDR-adjusted P < 0.05. Each box represents a GISTIC region, red indicates more frequent gain, and green indicates more frequent loss.
Figure 5
Figure 5
Association of OS with TOP2A-status, HER2 copy number levels, and GISTIC regions in HER2+ and HER2- tumors. (A) OS in primary HER2+ tumors stratified by TOP2A-status. (B) OS in primary HER2+ tumors stratified by the 25th (HER2+ CN low) and 75th percentile (HER2+ CN high) of the mean HER2 segmented log2ratio. (C) OS in primary HER2+ tumors stratified by the 15th (HER2+ CN low) and 85th percentile (HER2+ CN high) of the mean HER2 log2ratio. (D) GISTIC regions showing association with OS (log-rank P < 0.1) in the 176 primary HER2+ tumors. The vertical axis represents -log10(p) for log-rank, univariate and multivariate analysis. Tumor size and LN status were included as covariates in multivariate analyses beside GISTIC regions. Dashed lines indicate P = 0.1, 0.05 and 0.01. GISTIC regions are ordered according to their genomic position. (E) Association to OS for GISTIC regions in D in HER2- tumors. The vertical axis represents -log10(p) for log-rank, univariate and multivariate analysis. Tumor size and LN status were included as covariates in multivariate analyses besides GISTIC regions. Dashed lines indicate P = 0.1, 0.05 and 0.01. GISTIC regions are ordered according to their genomic position.

Comment in

References

    1. Jonkers J, Berns A. Oncogene addiction: sometimes a temporary slavery. Cancer Cell. 2004;6:535–538. - PubMed
    1. Slamon DJ, Clark GM, Wong SG, Levin WJ, Ullrich A, McGuire WL. Human breast cancer: correlation of relapse and survival with amplification of the HER-2/neu oncogene. Science. 1987;235:177–182. doi: 10.1126/science.3798106. - DOI - PubMed
    1. Paik S, Hazan R, Fisher ER, Sass RE, Fisher B, Redmond C, Schlessinger J, Lippman ME, King CR. Pathologic findings from the National Surgical Adjuvant Breast and Bowel Project: prognostic significance of erbB-2 protein overexpression in primary breast cancer. J Clin Oncol. 1990;8:103–112. - PubMed
    1. Smith I, Procter M, Gelber RD, Guillaume S, Feyereislova A, Dowsett M, Goldhirsch A, Untch M, Mariani G, Baselga J, Kaufmann M, Cameron D, Bell R, Bergh J, Coleman R, Wardley A, Harbeck N, Lopez RI, Mallmann P, Gelmon K, Wilcken N, Wist E, Sanchez Rovira P, Piccart-Gebhart MJ. 2-year follow-up of trastuzumab after adjuvant chemotherapy in HER2-positive breast cancer: a randomised controlled trial. Lancet. 2007;369:29–36. doi: 10.1016/S0140-6736(07)60028-2. - DOI - PubMed
    1. Romond EH, Perez EA, Bryant J, Suman VJ, Geyer CE Jr, Davidson NE, Tan-Chiu E, Martino S, Paik S, Kaufman PA, Swain SM, Pisansky TM, Fehrenbacher L, Kutteh LA, Vogel VG, Visscher DW, Yothers G, Jenkins RB, Brown AM, Dakhil SR, Mamounas EP, Lingle WL, Klein PM, Ingle JN, Wolmark N. Trastuzumab plus adjuvant chemotherapy for operable HER2-positive breast cancer. N Engl J Med. 2005;353:1673–1684. doi: 10.1056/NEJMoa052122. - DOI - PubMed

Publication types