NR2 subunits and NMDA receptors on lamina II inhibitory and excitatory interneurons of the mouse dorsal horn
- PMID: 20459616
- PMCID: PMC2879240
- DOI: 10.1186/1744-8069-6-26
NR2 subunits and NMDA receptors on lamina II inhibitory and excitatory interneurons of the mouse dorsal horn
Abstract
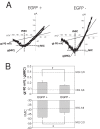
Background: NMDA receptors expressed by spinal cord neurons in the superficial dorsal horn are involved in the development of chronic pain associated with inflammation and nerve injury. The superficial dorsal horn has a complex and still poorly understood circuitry that is mainly populated by inhibitory and excitatory interneurons. Little is known about how NMDA receptor subunit composition, and therefore pharmacology and voltage dependence, varies with neuronal cell type. NMDA receptors are typically composed of two NR1 subunits and two of four NR2 subunits, NR2A-2D. We took advantage of the differences in Mg2+ sensitivity of the NMDA receptor subtypes together with subtype preferring antagonists to identify the NR2 subunit composition of NMDA receptors expressed on lamina II inhibitory and excitatory interneurons. To distinguish between excitatory and inhibitory interneurons, we used transgenic mice expressing enhanced green fluorescent protein driven by the GAD67 promoter.
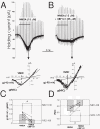
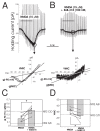
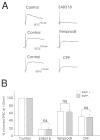
Results: Analysis of conductance ratio and selective antagonists showed that lamina II GABAergic interneurons express both the NR2A/B containing Mg2+ sensitive receptors and the NR2C/D containing NMDA receptors with less Mg2+ sensitivity. In contrast, excitatory lamina II interneurons express primarily NR2A/B containing receptors. Despite this clear difference in NMDA receptor subunit expression in the two neuronal populations, focally stimulated synaptic input is mediated exclusively by NR2A and 2B containing receptors in both neuronal populations.
Conclusions: Stronger expression of NMDA receptors with NR2C/D subunits by inhibitory interneurons compared to excitatory interneurons may provide a mechanism to selectively increase activity of inhibitory neurons during intense excitatory drive that can provide inhibitory feedback.
Figures


Similar articles
-
Synaptic GluN2A and GluN2B containing NMDA receptors within the superficial dorsal horn activated following primary afferent stimulation.J Neurosci. 2014 Aug 13;34(33):10808-20. doi: 10.1523/JNEUROSCI.0145-14.2014. J Neurosci. 2014. PMID: 25122884 Free PMC article.
-
Functional identification of NR2 subunits contributing to NMDA receptors on substance P receptor-expressing dorsal horn neurons.Mol Pain. 2008 Oct 10;4:44. doi: 10.1186/1744-8069-4-44. Mol Pain. 2008. PMID: 18847474 Free PMC article.
-
NMDA receptor 2B subunit-mediated synaptic transmission in the superficial dorsal horn of peripheral nerve-injured neuropathic mice.Brain Res. 2007 Mar 2;1135(1):92-101. doi: 10.1016/j.brainres.2006.12.014. Epub 2007 Jan 2. Brain Res. 2007. PMID: 17198690
-
Diverse roles and modulations of IA in spinal cord pain circuits.Cell Rep. 2022 Mar 29;38(13):110588. doi: 10.1016/j.celrep.2022.110588. Cell Rep. 2022. PMID: 35354022 Review.
-
Advances and Barriers in Understanding Presynaptic N-Methyl-D-Aspartate Receptors in Spinal Pain Processing.Front Mol Neurosci. 2022 Mar 31;15:864502. doi: 10.3389/fnmol.2022.864502. eCollection 2022. Front Mol Neurosci. 2022. PMID: 35431805 Free PMC article. Review.
Cited by
-
Synaptic GluN2A and GluN2B containing NMDA receptors within the superficial dorsal horn activated following primary afferent stimulation.J Neurosci. 2014 Aug 13;34(33):10808-20. doi: 10.1523/JNEUROSCI.0145-14.2014. J Neurosci. 2014. PMID: 25122884 Free PMC article.
-
Neonatal tissue damage facilitates nociceptive synaptic input to the developing superficial dorsal horn via NGF-dependent mechanisms.Pain. 2011 Aug;152(8):1846-1855. doi: 10.1016/j.pain.2011.04.001. Epub 2011 May 6. Pain. 2011. PMID: 21550171 Free PMC article.
-
Roles of Phosphorylation of N-Methyl-D-Aspartate Receptor in Chronic Pain.Cell Mol Neurobiol. 2023 Jan;43(1):155-175. doi: 10.1007/s10571-022-01188-6. Epub 2022 Jan 15. Cell Mol Neurobiol. 2023. PMID: 35032275 Free PMC article. Review.
-
Pharmacological modulation of NMDA receptor activity and the advent of negative and positive allosteric modulators.Neurochem Int. 2012 Sep;61(4):581-92. doi: 10.1016/j.neuint.2012.01.004. Epub 2012 Jan 17. Neurochem Int. 2012. PMID: 22269804 Free PMC article. Review.
-
Dynamics of spiking neurons: between homogeneity and synchrony.J Comput Neurosci. 2013 Jun;34(3):433-60. doi: 10.1007/s10827-012-0429-1. Epub 2012 Oct 25. J Comput Neurosci. 2013. PMID: 23096934
References
Publication types
MeSH terms
Substances
Grants and funding
LinkOut - more resources
Full Text Sources
Molecular Biology Databases

