

Distinct high resolution genome profiles of early onset and late onset colorectal cancer integrated with gene expression data identify candidate susceptibility loci
- PMID: 20459617
- PMCID: PMC2885343
- DOI: 10.1186/1476-4598-9-100
Distinct high resolution genome profiles of early onset and late onset colorectal cancer integrated with gene expression data identify candidate susceptibility loci
Abstract
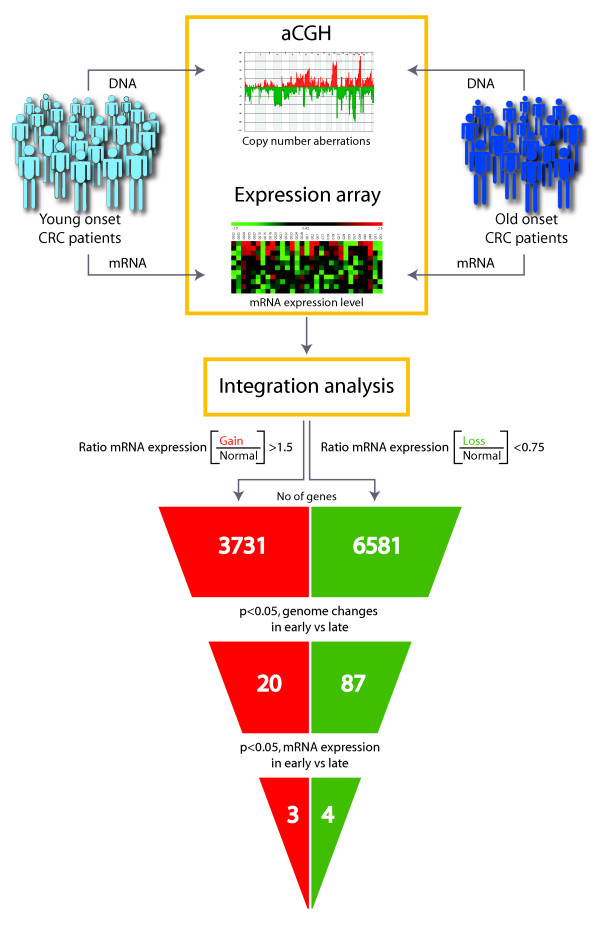
Background: Estimates suggest that up to 30% of colorectal cancers (CRC) may develop due to an increased genetic risk. The mean age at diagnosis for CRC is about 70 years. Time of disease onset 20 years younger than the mean age is assumed to be indicative of genetic susceptibility. We have compared high resolution tumor genome copy number variation (CNV) (Roche NimbleGen, 385 000 oligo CGH array) in microsatellite stable (MSS) tumors from two age groups, including 23 young at onset patients without known hereditary syndromes and with a median age of 44 years (range: 28-53) and 17 elderly patients with median age 79 years (range: 69-87). Our aim was to identify differences in the tumor genomes between these groups and pinpoint potential susceptibility loci. Integration analysis of CNV and genome wide mRNA expression data, available for the same tumors, was performed to identify a restricted candidate gene list.
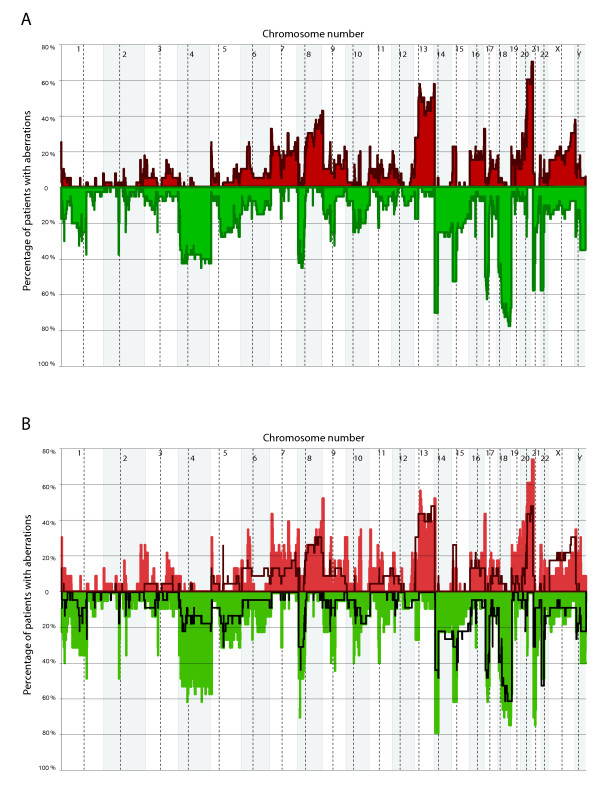
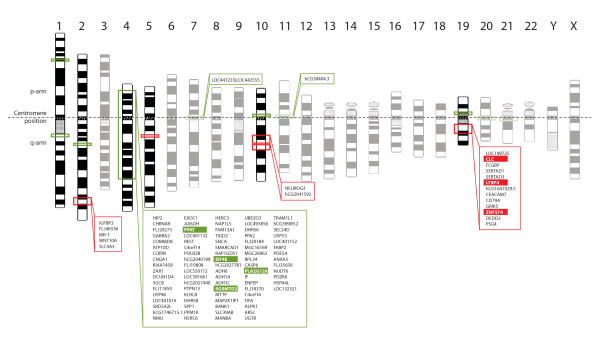
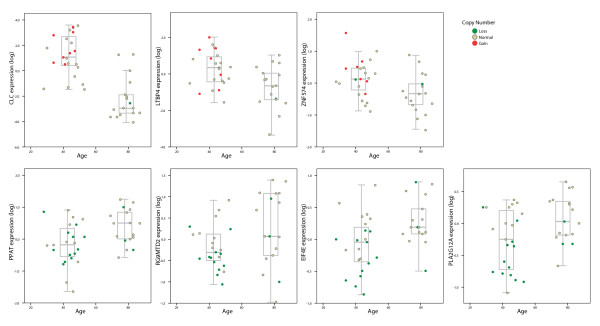
Results: The total fraction of the genome with aberrant copy number, the overall genomic profile and the TP53 mutation spectrum were similar between the two age groups. However, both the number of chromosomal aberrations and the number of breakpoints differed significantly between the groups. Gains of 2q35, 10q21.3-22.1, 10q22.3 and 19q13.2-13.31 and losses from 1p31.3, 1q21.1, 2q21.2, 4p16.1-q28.3, 10p11.1 and 19p12, positions that in total contain more than 500 genes, were found significantly more often in the early onset group as compared to the late onset group. Integration analysis revealed a covariation of DNA copy number at these sites and mRNA expression for 107 of the genes. Seven of these genes, CLC, EIF4E, LTBP4, PLA2G12A, PPAT, RG9MTD2, and ZNF574, had significantly different mRNA expression comparing median expression levels across the transcriptome between the two groups.
Conclusions: Ten genomic loci, containing more than 500 protein coding genes, are identified as more often altered in tumors from early onset versus late onset CRC. Integration of genome and transcriptome data identifies seven novel candidate genes with the potential to identify an increased risk for CRC.
Figures
References
-
- Lichtenstein P, Holm NV, Verkasalo PK, Iliadou A, Kaprio J, Koskenvuo M, Pukkala E, Skytthe A, Hemminki K. Environmental and heritable factors in the causation of cancer--analyses of cohorts of twins from Sweden, Denmark, and Finland. N Engl J Med. 2000;343:78–85. doi: 10.1056/NEJM200007133430201. - DOI - PubMed
-
- Jaeger E, Webb E, Howarth K, Carvajal-Carmona L, Rowan A, Broderick P, Walther A, Spain S, Pittman A, Kemp Z, Sullivan K, Heinimann K, Lubbe S, Domingo E, Barclay E, Martin L, Gorman M, Chandler I, Vijayakrishnan J, Wood W, Papaemmanuil E, Penegar S, Qureshi M, Farrington S, Tenesa A, Cazier JB, Kerr D, Gray R, Peto J, Dunlop M. Common genetic variants at the CRAC1 (HMPS) locus on chromosome 15q13.3 influence colorectal cancer risk. Nat Genet. 2008;40:26–28. doi: 10.1038/ng.2007.41. - DOI - PubMed
-
- Zanke BW, Greenwood CM, Rangrej J, Kustra R, Tenesa A, Farrington SM, Prendergast J, Olschwang S, Chiang T, Crowdy E, Ferretti V, Laflamme P, Sundararajan S, Roumy S, Olivier JF, Robidoux F, Sladek R, Montpetit A, Campbell P, Bezieau S, O'Shea AM, Zogopoulos G, Cotterchio M, Newcomb P, McLaughlin J, Younghusband B, Green R, Green J, Porteous ME, Campbell H. Genome-wide association scan identifies a colorectal cancer susceptibility locus on chromosome 8q24. Nat Genet. 2007;39:989–994. doi: 10.1038/ng2089. - DOI - PubMed
Publication types
MeSH terms
Substances
LinkOut - more resources
Full Text Sources
Medical
Research Materials
Miscellaneous
