. 2010 May 6:11:286.
doi: 10.1186/1471-2164-11-286.

Most transcription factor binding sites are in a few mosaic classes of the human genome

Affiliations

Most transcription factor binding sites are in a few mosaic classes of the human genome

Kenneth J Evans. BMC Genomics. .

Abstract

Background: Many algorithms for finding transcription factor binding sites have concentrated on the characterisation of the binding site itself: and these algorithms lead to a large number of false positive sites. The DNA sequence which does not bind has been modeled only to the extent necessary to complement this formulation.

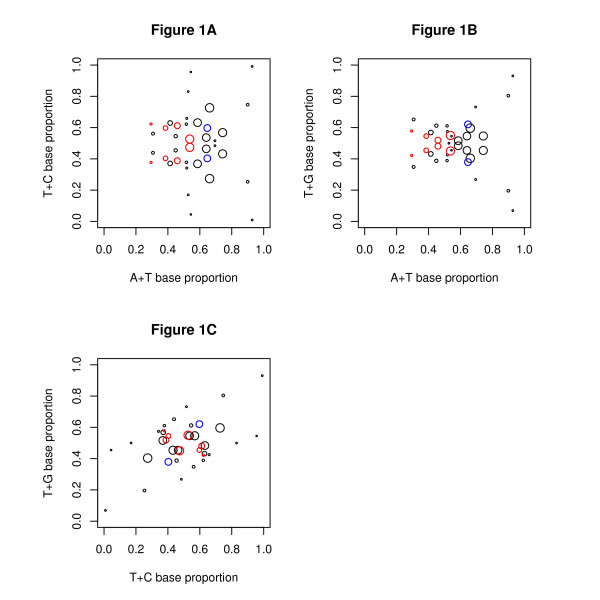
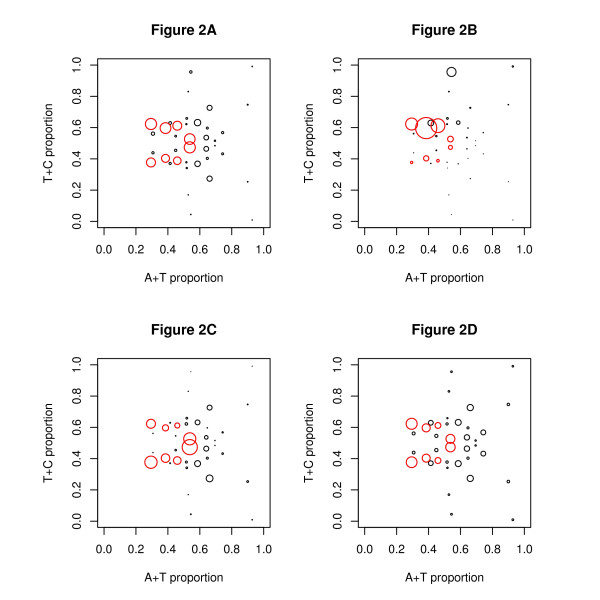
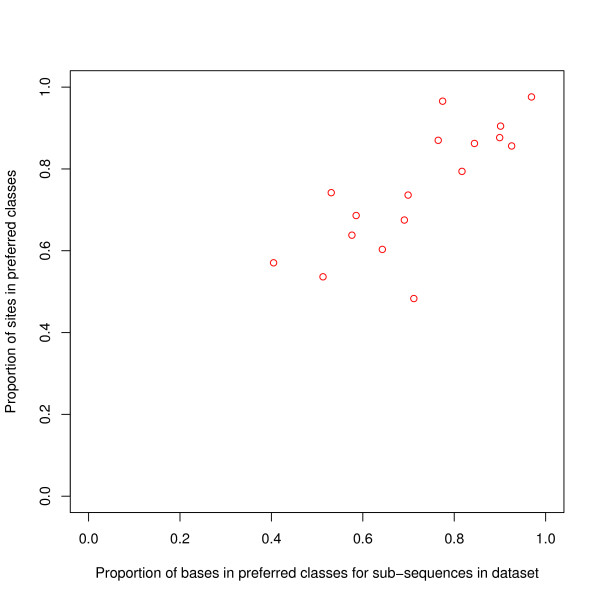
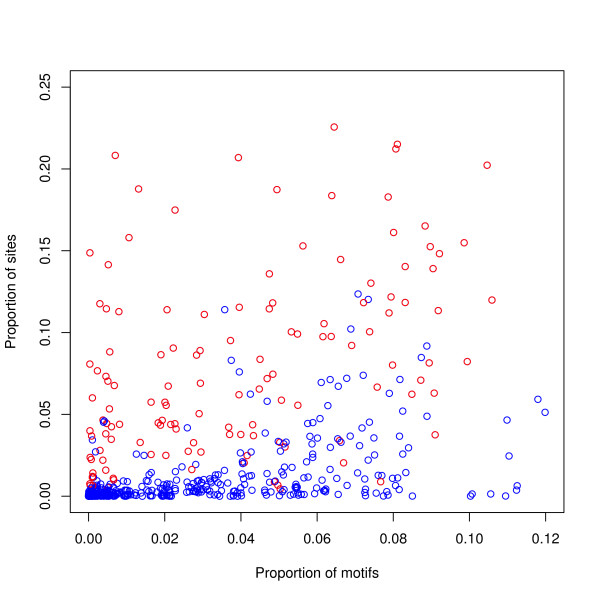
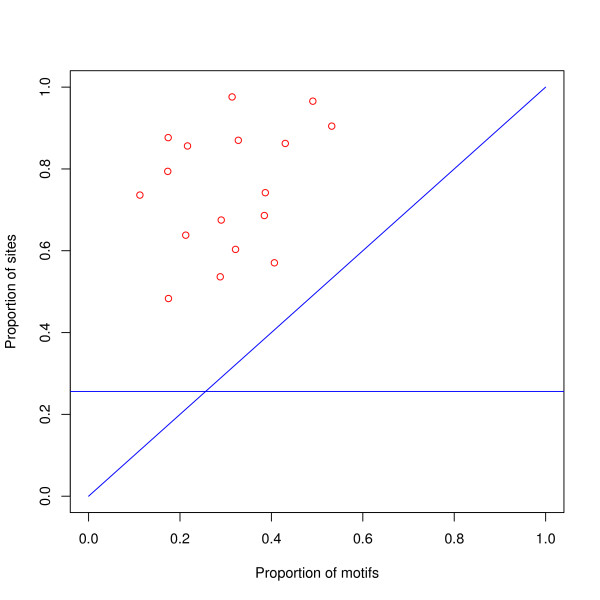
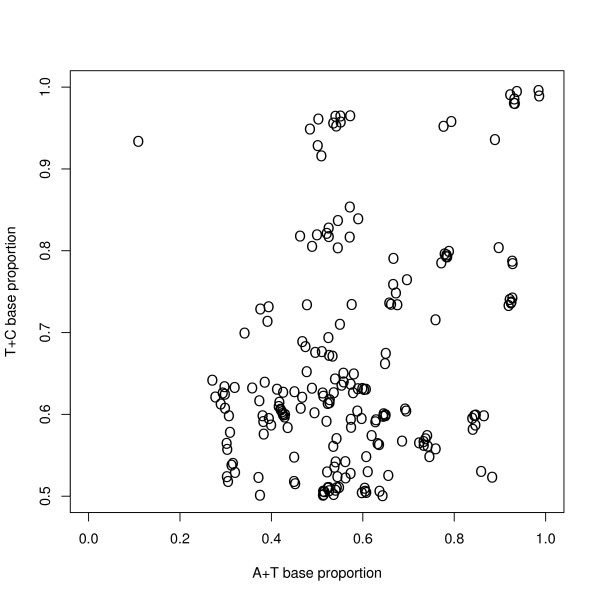
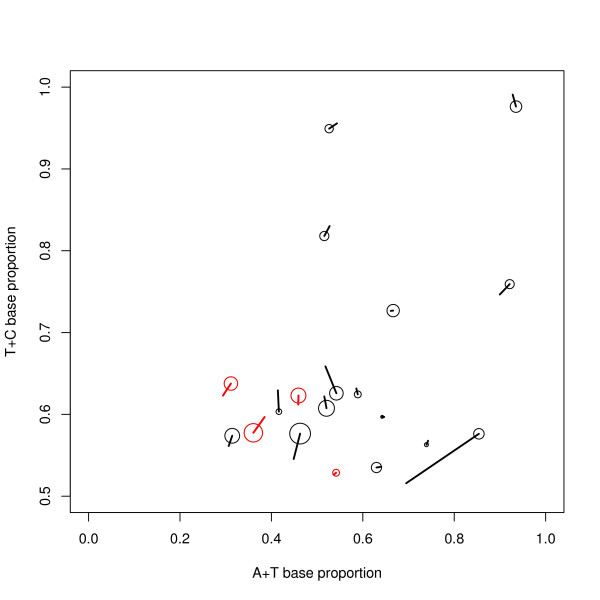
Results: We find that the human genome may be described by 19 pairs of mosaic classes, each defined by its base frequencies, (or more precisely by the frequencies of doublets), so that typically a run of 10 to 100 bases belongs to the same class. Most experimentally verified binding sites are in the same four pairs of classes. In our sample of seventeen transcription factors - taken from different families of transcription factors - the average proportion of sites in this subset of classes was 75%, with values for individual factors ranging from 48% to 98%. By contrast these same classes contain only 26% of the bases of the genome and only 31% of occurrences of the motifs of these factors - that is places where one might expect the factors to bind. These results are not a consequence of the class composition in promoter regions.

Conclusions: This method of analysis will help to find transcription factor binding sites and assist with the problem of false positives. These results also imply a profound difference between the mosaic classes.


Figures

Figure 1
Figure 1
The mosaic classes of the human genome. Each circle represents one of the mosaic classes. The position of the circle shows the A/C/G/T content:-(a) T+C by A+T, (b) T+G by A+T, (c) T+G by T+C. The area of the circle shows the proportion of the genome contained in the class. The preferred classes (pairs 2, 7, 9 and 14) contain the most transcription factor binding sites and are shown in red. The classes of pair 6 are comparatively long: they are plotted in the same way as the others but are shown in blue. The purpose of this plot is to give a visualisation of the mosaic classes. The genome is AT rich so it is not surprising that there is a preponderance of classes on the right hand side of Figures 1A and 1B. Strand symmetry gives an exact symmetry about the horizontal line T+C = 0.5 in (a) and T+G = 0.5 in (b). In (c), the strand symmetry shows itself as an axial symmetry--that is the line between paired classes is bisected by the central point. All proportions have been calculated from the steady state of the HMM.
Figure 2
Figure 2
Classes at binding sites and in the promoter regions. The position of each mosaic class has been plotted as in Figure 1A. The area of each circle shows the proportion of binding sites in the class for (a) all 17 transcription factors (b) the transcription factor ZNF263 (c) the transcription factor SRF. Subplot (d) gives a comparison for bases in promoter regions (defined as the 1000 bases upstream of the TSS — the plot is based on all coding genes). The preferred classes are shown in red and contain (a) 75%, (b) 86% and (c) 79% of the binding sites. In (d) the preferred classes contain 60% of the bases--this percentage is high but not as high as for (a). The lack of symmetry in Figures 2B and 2C implies a preferred orientation/strand of the binding site within the class.
Figure 3
Figure 3
Binding sites versus entire subsequences -- proportion of bases in the preferred classes. For each transcription factor, the proportion of binding sites in the preferred classes has been plotted against the proportion of all bases in the preferred classes in all the sequences of the dataset. The latter proportion has been calculated for each sequence separately and then averaged over the sequences of the dataset. There is a strong relationship between the plotted variables: the correlation coefficient is 0.78.
Figure 4
Figure 4
Position of binding site within subsequence. For each binding site, we have calculated p = the number of bases to the nearer end of the subsequence divided by the length of the subsequence; and for each dataset we have calculated the histogram of these proportions. The Figure shows the average heights of the histograms of individual datasets and shows a strong tendency for the binding site to be in the middle of the subsequence.
Figure 5
Figure 5
Proportion of binding sites versus proportion of motifs for individual classes. For each of the 17 transcription factors, the proportion of binding sites in each mosaic class has been plotted against the proportion of motifs found in this class. The preferred classes have been plotted in red and the other classes in blue. As there are 19 pairs of classes, (4 pairs of preferred classes and 15 pairs of non-preferred classes), each transcription factor contributes 8 red points and 30 blue points to the graph. There is a correlation between the variables (Spearman coefficient = 0.68), but this comes from the mass of points near the x-axis, so that the proportion of motifs is not a useful predictor of the proportion of sites. Not plotted is a red point outlier at (0.01, 0.62).
Figure 6
Figure 6
Proportion of binding sites versus proportion of motifs in the preferred classes. For each of the 17 transcription factors, the proportion of binding sites in the preferred classes has been plotted against the proportion of motifs in these classes. The height of the horizontal line gives the proportion of all bases in the genome in these classes. The Figure shows that for the preferred classes the proportion of sites is greater than the proportion of motifs: it also shows that the proportion of motifs is not a good predictor of the proportion of sites for these classes. It can also be seen that the proportion of sites is greater than the proportion of the genome in the preferred classes.
Figure 7
Figure 7
Classes from constituent runs — T+C versus A+T. The classes found from each of the 8 preliminary replication runs have been overlaid on the same plot. The classes have been plotted by their A+T and T+C content as in Figure 1A, except that the figure includes only classes with T+C > 0.5 — the omitted classes mirror those shown. The plot shows a strong similarity between the results of the replication runs, showing the reproducibility of the method--a point taken up in Figure 8. Each replication run was randomly initialised with 25 pairs of matched classes, and trained on 6000 sequences of 2000 bases taken at random from the human genome.
Figure 8
Figure 8
Uncertainty in the A+T and T+C proportions of the mosaic classes. The circles show the position of the classes used to initialise the final HMM training run. The radius of these circles is the standard error of this initial position calculated from the positions of the classes averaged to produce these initial classes--compare Figure 7. The line from each circle shows the position of the class after the final HMM training run, which is also shown in Figure 1A. The figure shows only the region T+C > 0.5--the omitted region mirrors the region shown. The statistical robustness of the method for deriving the mosaic classes is demonstrated by i) the consistency of the results of the preliminary runs shown by the small size of the circles and ii) the small difference between the classes at the beginning and end of the final training run shown by the short length of the lines.

Similar articles

Cited by

References

    1. The ENCODE Project Consortium. Identification and analysis of functional elements in 1% of the human genome by the ENCODE pilot project. Nature. 2007;447:799–816. doi: 10.1038/nature05874. - DOI - PMC - PubMed
    1. Cawley S, Bekiranov S, Ng HH, Kapranov P, Sekinger EA, Kampa D, Piccolboni A, Sementchenko V, Cheng J, Williams AJ, Wheeler R, Wong B, Drenkow J, Yamanaka M, Patel S, Brubaker S, Tammana H, Helt G, Struhl K, Gingeras TR. Unbiased mapping of transcription factor binding sites along human chromosomes 21 and 22 points to widespread regulation of noncoding RNAs. Cell. 2004;116(4):499–509. doi: 10.1016/S0092-8674(04)00127-8. - DOI - PubMed
    1. Das MK, Dai HK. A survey of DNA motif finding algorithms. BMC Bioinformatics. 2007;8(Suppl 7):S21. doi: 10.1186/1471-2105-8-S7-S21. - DOI - PMC - PubMed
    1. Sosinsky A, Honig B, Mann RS, Califano A. Discovering transcriptional regulatory regions in Drosophila by a nonalignment method for phylogenetic footprinting. Proc Natl Acad Sci USA. 2007;104:6305–6310. doi: 10.1073/pnas.0701614104. - DOI - PMC - PubMed
    1. Blanchette M, Tompa M. Discovery of Regulatory Elements by a Computational Method for Phylogenetic Footprinting. Genome Res. 2002;12:739–748. doi: 10.1101/gr.6902. - DOI - PMC - PubMed

Substances

LinkOut - more resources