. 2010 May 7:10:85.
doi: 10.1186/1471-2229-10-85.

Transcript profiling of common bean (Phaseolus vulgaris L.) using the GeneChip Soybean Genome Array: optimizing analysis by masking biased probes

Affiliations

Transcript profiling of common bean (Phaseolus vulgaris L.) using the GeneChip Soybean Genome Array: optimizing analysis by masking biased probes

S Samuel Yang et al. BMC Plant Biol. .

Abstract

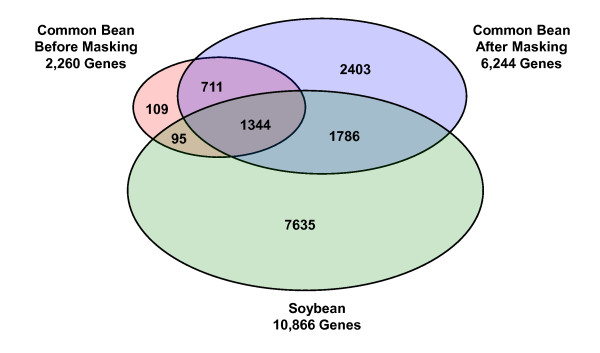
Background: Common bean (Phaseolus vulgaris L.) and soybean (Glycine max) both belong to the Phaseoleae tribe and share significant coding sequence homology. This suggests that the GeneChip(R) Soybean Genome Array (soybean GeneChip) may be used for gene expression studies using common bean.

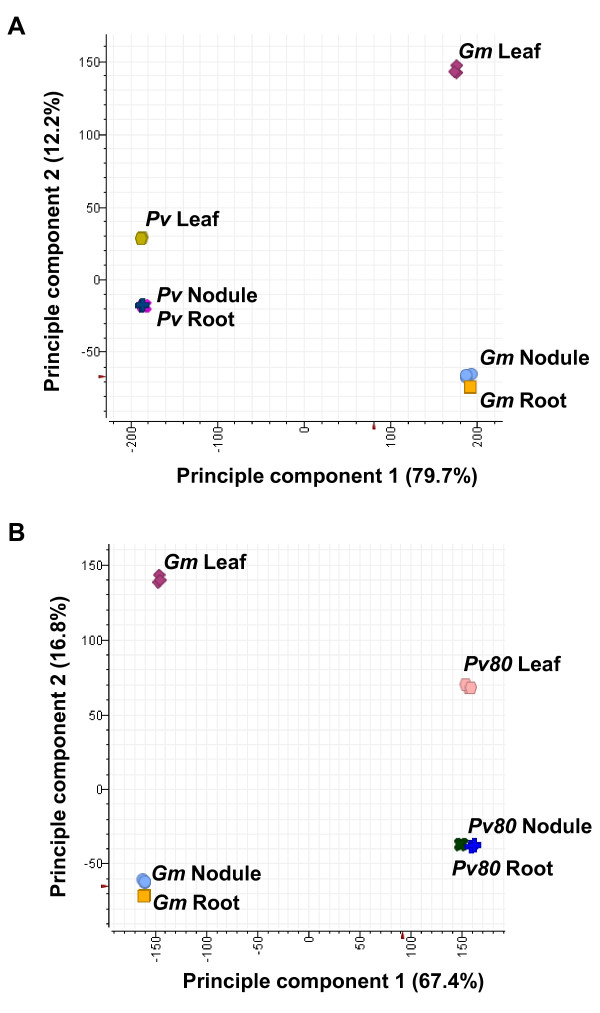
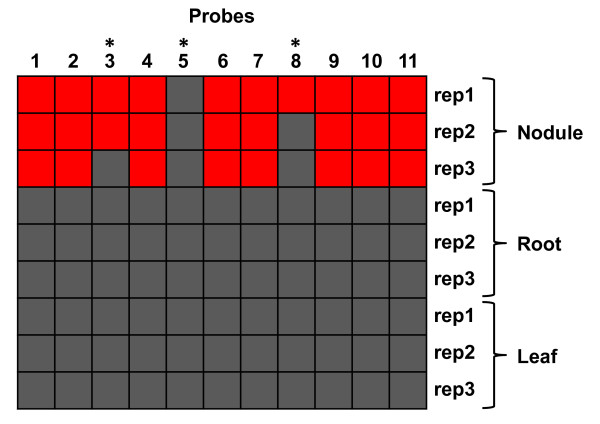
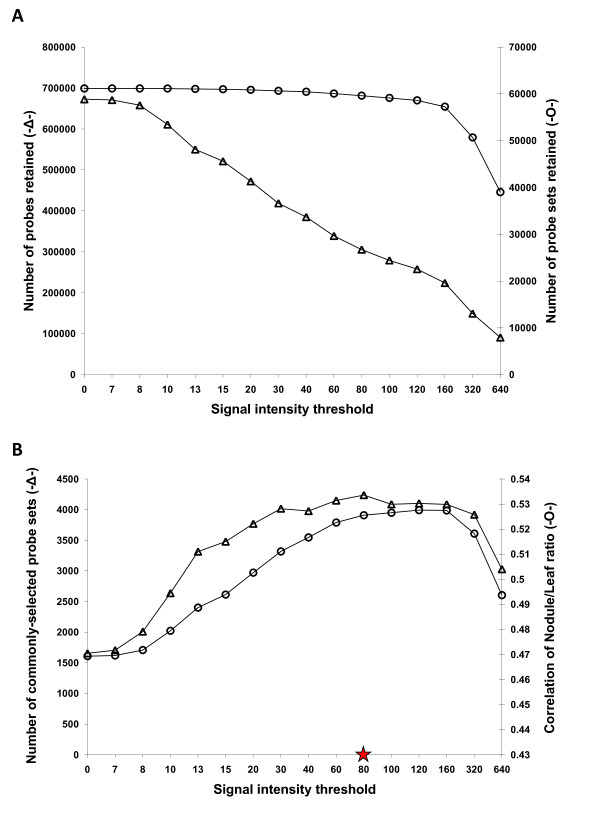
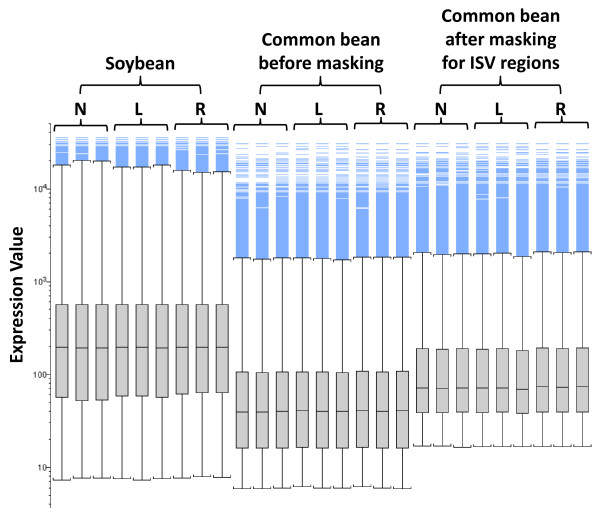
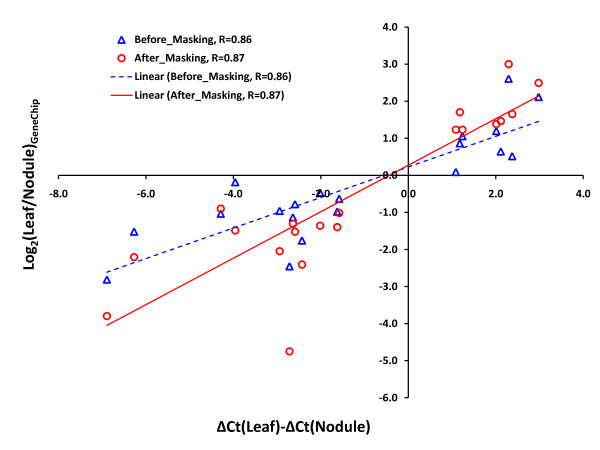
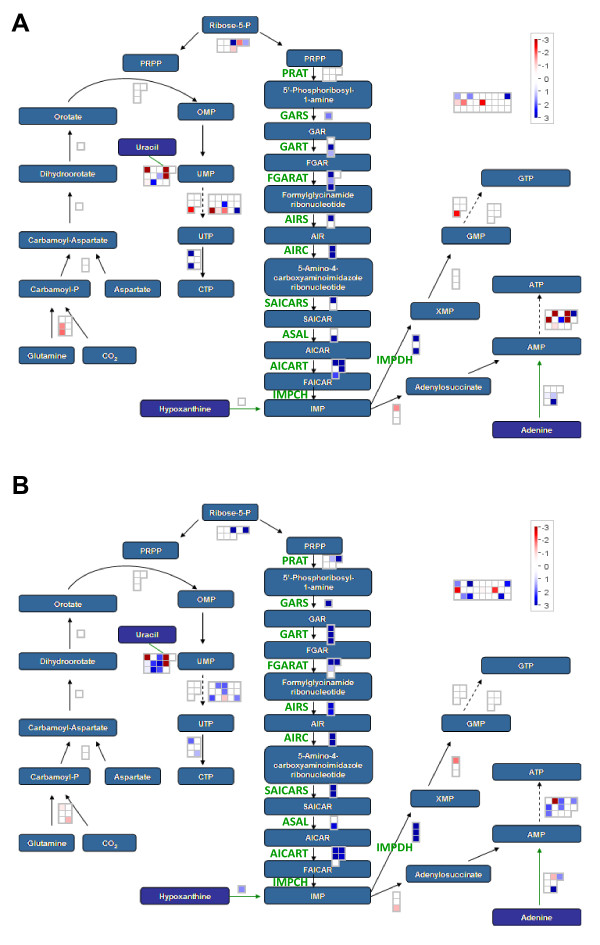
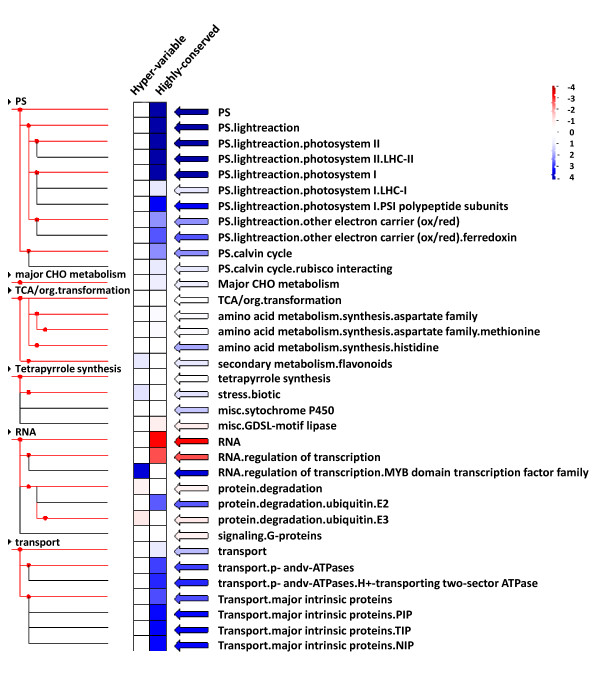
Results: To evaluate the utility of the soybean GeneChip for transcript profiling of common bean, we hybridized cRNAs purified from nodule, leaf, and root of common bean and soybean in triplicate to the soybean GeneChip. Initial data analysis showed a decreased sensitivity and accuracy of measuring differential gene expression in common bean cross-species hybridization (CSH) GeneChip data compared to that of soybean. We employed a method that masked putative probes targeting inter-species variable (ISV) regions between common bean and soybean. A masking signal intensity threshold was selected that optimized both sensitivity and accuracy of measuring differential gene expression. After masking for ISV regions, the number of differentially-expressed genes identified in common bean was increased by 2.8-fold reflecting increased sensitivity. Quantitative RT-PCR (qRT-PCR) analysis of 20 randomly selected genes and purine-ureide pathway genes demonstrated an increased accuracy of measuring differential gene expression after masking for ISV regions. We also evaluated masked probe frequency per probe set to gain insight into the sequence divergence pattern between common bean and soybean. The sequence divergence pattern analysis suggested that the genes for basic cellular functions and metabolism were highly conserved between soybean and common bean. Additionally, our results show that some classes of genes, particularly those associated with environmental adaptation, are highly divergent.

Conclusions: The soybean GeneChip is a suitable cross-species platform for transcript profiling in common bean when used in combination with the masking protocol described. In addition to transcript profiling, CSH of the GeneChip in combination with masking probes in the ISV regions can be used for comparative ecological and/or evolutionary genomics studies.


Figures

Figure 1
Figure 1
Principal component analysis of the GeneChip data from nodule, leaf, and root tissue samples of common bean and soybean before (A) and after (B) masking probes with a signal intensity threshold of 80. The first and second principal components together accounted for about 92% and 84% of the total variation in the data before and after masking, respectively. The percentages represent the variation explained by each principal component. Gm, Glycine max; Pv, Phaseolus vulgaris L.; Pv80, Phaseolus vulgaris L. after masking with signal intensity threshold 80.
Figure 2
Figure 2
Masking putative probes targeting ISV regions. For each common bean tissue sample, three biological replicates were collected producing a total of 9 data points per probe (3 tissue types × 3 replicates). For a particular probe, all data points were kept if three or more signals were above the signal intensity threshold. Otherwise, all 9 signals were masked (see Methods for details). Red and grey squares represent signals above and below the masking signal intensity threshold, respectively. Asterisk, probes with less than 3 signals above the masking signal intensity threshold.
Figure 3
Figure 3
Selection of the optimum signal intensity threshold for masking probes targeting interspecies-variable regions. A. The number of probes (triangles) and probe sets (circles) retained after masking probes with a series of signal intensity thresholds. B. Effect of probe masking over a range of signal intensity thresholds (0-640) on the number of probe sets commonly-selected in soybean and common bean (circles) and the correlation of the Leaf/Nodule hybridization intensity ratio for the commonly selected genes (triangles). A signal intensity threshold of 80 (red star) was selected to mask biased probes. Commonly-selected genes are defined as genes exhibiting at least a 2-fold difference in hybridization intensity expression ratio between leaf and nodule tissue (leaf vs. nodule, ≥ 2-fold difference) for both soybean and common bean.
Figure 4
Figure 4
Box plots of 9 GeneChip data sets (3 tissue types × 3 replications) from soybean and common bean before and after masking for ISV regions (signal intensity threshold = 80). Blue lines simply represent outliers.
Figure 5
Figure 5
Venn diagram showing numbers of overlapping and non-overlapping genes differentially expressed among three different organs of soybean and common bean before masking and after masking for ISV regions (threshold = 80). Differentially expressed genes were identified after an ANOVA (p-value < 0.0001, FDR < 0.0015) with an additional cutoff of a 2-fold ratio in pair-wise comparisons (i.e., nodule vs. leaf; nodule vs. root; root vs. leaf).
Figure 6
Figure 6
qRT-PCR validation of the common bean CSH GeneChip data. A total of 20 randomly selected genes were used for qRT-PCR validation. ΔΔCT values obtained from the qRT-PCR data were plotted against log2(Leaf/Nodule) hybridization intensity ratio values from the GeneChip data before (blue triangles) and after (red circles) masking. R, Pearson correlation coefficient.
Figure 7
Figure 7
MapMan overview of nucleotide synthesis showing the purine pathway genes that are preferentially expressed in nodule compared to leaf tissue in common bean (A) and soybean (B). Individual genes are represented by small squares. The Log2(nodule/leaf) values for the differentially expressed genes (p < 0.0001, FDR < 0.0015, ≥ 2-fold difference) were false color coded using a scale of -3 to ± 3. The intensity of blue and red colors indicates the degree of preferential expression of the corresponding genes in nodule and leaf, respectively. Color saturates at ± 3 (8-fold difference or higher). See Methods for details. A complete list of the differentially expressed genes, corresponding MapMan functional categories, signal intensities and log ratios are provided in additional file 1 and 2. Abbreviations: PRPP: phosphoribosyl pyrophosphate, PRAT: PRPP amidotransferase, GARS: GAR synthetase, GAR: glycinamide ribonucleotide, GART: GAR transformylase, FGAR: formylglycinamide ribonucleotide, FGARAT: FGAR amidotransferase, AIRS: AIR synthetase, AIR: aminoimidazole ribonucleotide, AIRC: AIR carboxylase, SAICARS: SAICAR synthetase, SAICAR: succinoaminoimidazolecarboximide ribonucleotide, ASAL: adenylosuccinate-AMP lyase, AICAR: aminoimidazolecarboximide ribonucleotide, AICART: AICAR transformylase, FAICAR: formylaminoimidazolecarboximide ribonucleotide, IMPCH: IMP cyclohydrolase, IMP: inosine monophosphate, IMPDH: IMP dehydrogenase.
Figure 8
Figure 8
Over-representation analysis of the hyper-variable and the highly-conserved probe set groups. The Hyper-variable probe set group retained only 1 or 2 probes, and the highly conserved probe sets group retained 10 or 11 (all) probes after masking with a signal intensity threshold of 80. The Fisher's exact test was performed using the PageMan over-representation analysis module. Over- or under-represented classes in each group were identified after Bonferroni correction (z-value cutoff value = 1.0). The resulting values were then false color coded using a scale of -4 to +4. Blue and red indicate over- and under-representation of the corresponding class, respectively. See methods for details.

Similar articles

Cited by

References

    1. Gepts P. Origin and evolution of common bean: past events and recent trends. Hort Sci. 1988;33:1124–1130.
    1. Doyle JJ, Luckow MA. The rest of the iceberg Legume diversity, evolution in a phylogenetic context. Plant Physiol. 2003;131:900–910. doi: 10.1104/pp.102.018150. - DOI - PMC - PubMed
    1. Food and Agriculture Organization of the United Nations. http://faostat.fao.org/
    1. McClean P, Kami J, Gepts P. In: Legume Crop Genomics. Wilson RF, Stalker HT, Brummer EC, editor. Champaign, IL: AOCS Press; 2004. Genomic and genetic diversity in common bean; pp. 60–82.
    1. Broughton WJ, Hernández G, Blair M, Beebe S, Gepts P, Vanderleyden J. Beans (Phaseolus spp.)-model food legume. Plant Soil. 2003;252:55–128. doi: 10.1023/A:1024146710611. - DOI

MeSH terms