. 2010 May 10:7:41.
doi: 10.1186/1742-4690-7-41.

Live cell visualization of the interactions between HIV-1 Gag and the cellular RNA-binding protein Staufen1

Affiliations

Live cell visualization of the interactions between HIV-1 Gag and the cellular RNA-binding protein Staufen1

Miroslav P Milev et al. Retrovirology. .

Abstract

Background: Human immunodeficiency virus type 1 (HIV-1) uses cellular proteins and machinery to ensure transmission to uninfected cells. Although the host proteins involved in the transport of viral components toward the plasma membrane have been investigated, the dynamics of this process remain incompletely described. Previously we showed that the double-stranded (ds)RNA-binding protein, Staufen1 is found in the HIV-1 ribonucleoprotein (RNP) that contains the HIV-1 genomic RNA (vRNA), Gag and other host RNA-binding proteins in HIV-1-producing cells. Staufen1 interacts with the nucleocapsid domain (NC) domain of Gag and regulates Gag multimerization on membranes thereby modulating HIV-1 assembly. The formation of the HIV-1 RNP is dynamic and likely central to the fate of the vRNA during the late phase of the HIV-1 replication cycle.

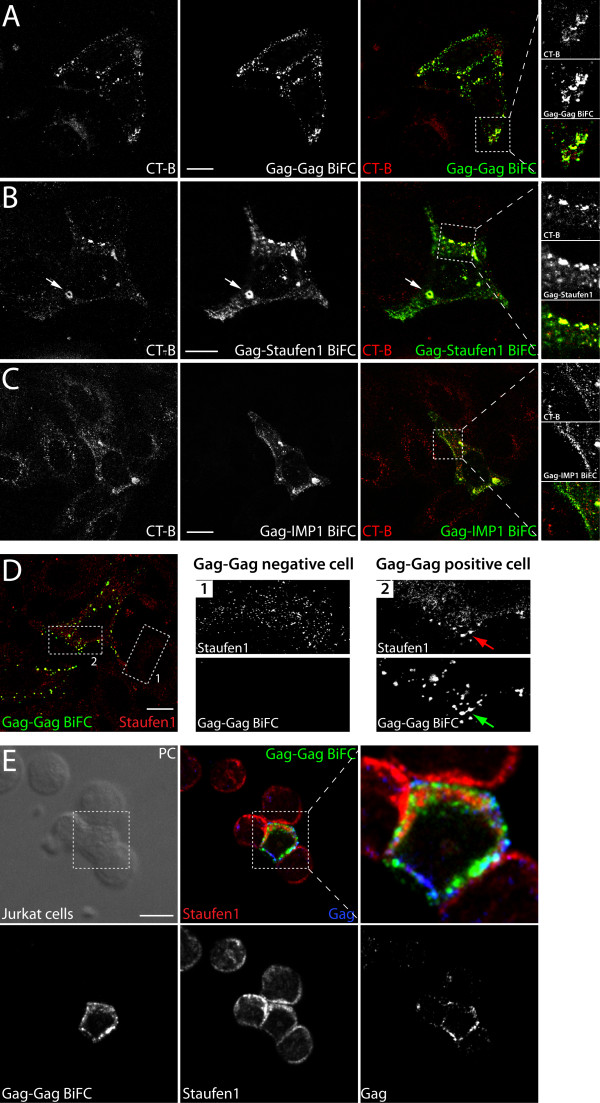
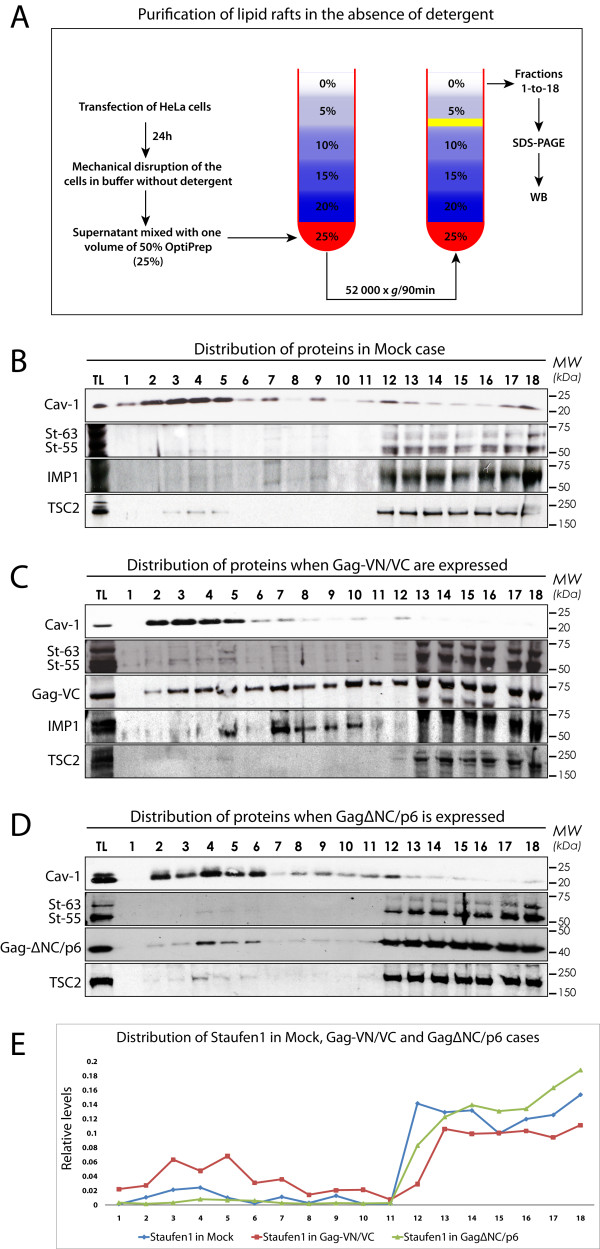
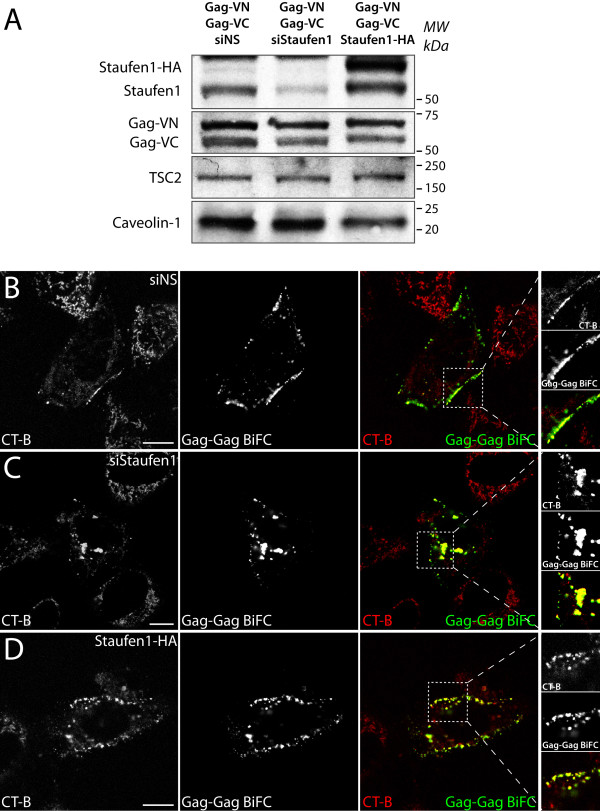
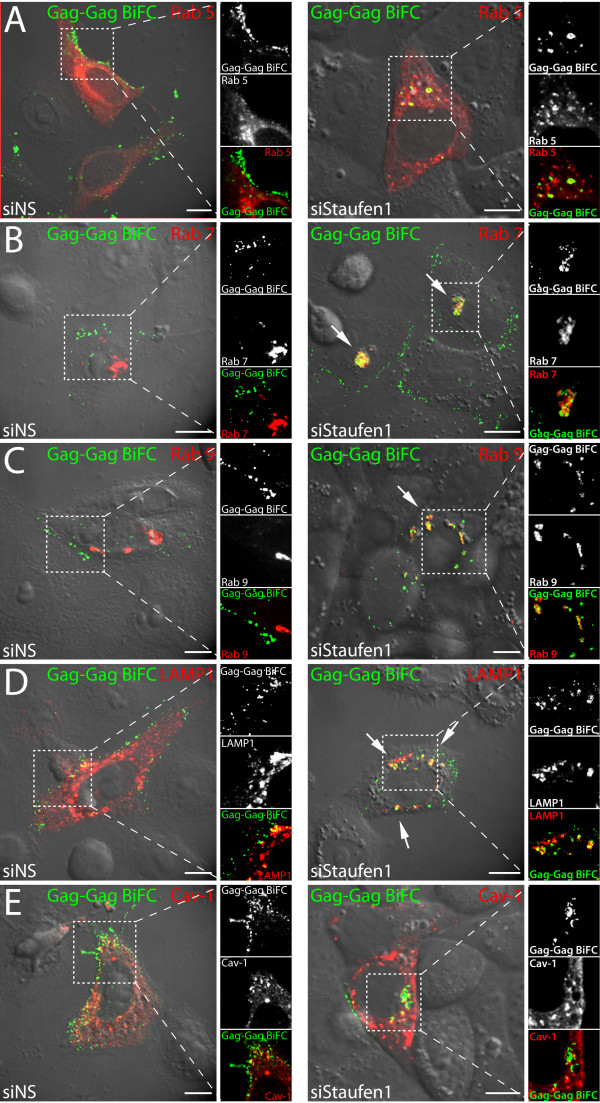
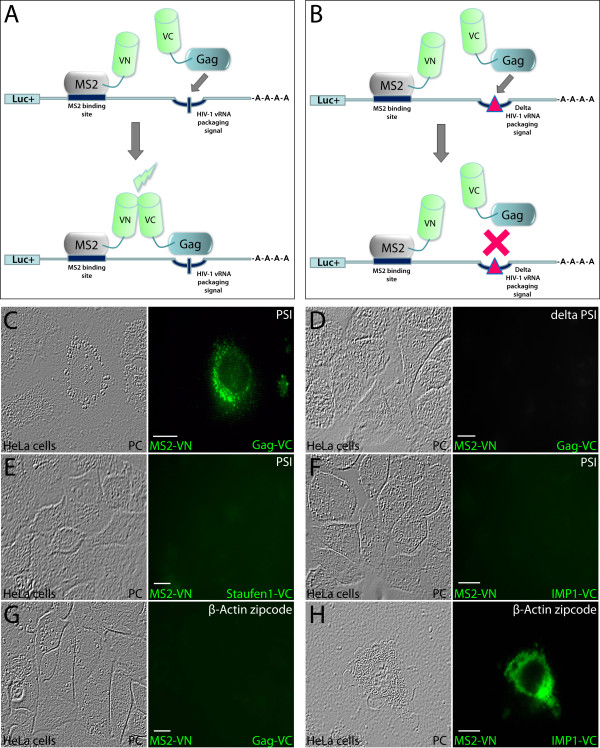
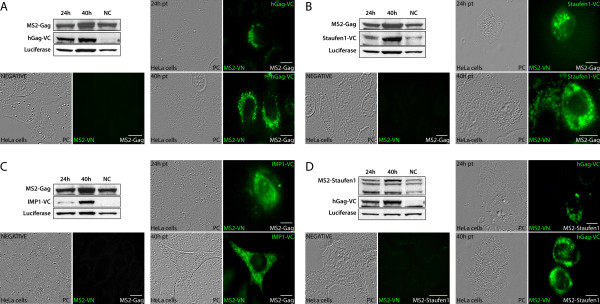
Results: Detailed molecular imaging of both the intracellular trafficking of virus components and of virus-host protein complexes is critical to enhance our understanding of factors that contribute to HIV-1 pathogenesis. In this work, we visualized the interactions between Gag and host proteins using bimolecular and trimolecular fluorescence complementation (BiFC and TriFC) analyses. These methods allow for the direct visualization of the localization of protein-protein and protein-protein-RNA interactions in live cells. We identified where the virus-host interactions between Gag and Staufen1 and Gag and IMP1 (also known as VICKZ1, IGF2BP1 and ZBP1) occur in cells. These virus-host interactions were not only detected in the cytoplasm, but were also found at cholesterol-enriched GM1-containing lipid raft plasma membrane domains. Importantly, Gag specifically recruited Staufen1 to the detergent insoluble membranes supporting a key function for this host factor during virus assembly. Notably, the TriFC experiments showed that Gag and Staufen1 actively recruited protein partners when tethered to mRNA.

Conclusions: The present work characterizes the interaction sites of key components of the HIV-1 RNP (Gag, Staufen1 and IMP1), thereby bringing to light where HIV-1 recruits and co-opts RNA-binding proteins during virus assembly.


Figures

Figure 1
Figure 1
Gag interactions with host proteins Staufen1 and IMP1 occur in the cytoplasm and at the plasma membrane of transfected HeLa and Jurkat T cells as determined by BiFC. (A) Top - schematic representation of BiFC method. Bottom - Rev-dependent Gag-VN and Gag-VC were co-transfected with pCMV-Rev in HeLa cells. At 24 hr post-transfection, cells were imaged by laser scanning confocal microscopy to detect BiFC. The white arrows indicate plasma membrane concentrated accumulations of Gag-Gag BiFC signals. (B) Gag-VN and Staufen1-VC (top panels) or Gag-VN and IMP1-VC (bottom panels) interactions identified by BiFC. BiFC signals for these interacting pairs were mainly detected in the cytoplasm (indicated by white arrows) and at or near the plasma membrane. (C) Interactions between Gag-VN with IMP1-KH(1-4)-VC (top) and with IMP1-RRM(1-2)-VC (bottom) as determined by BiFC analysis. Evidence for interaction is demonstrated by a green fluorescence signal. (D) The interaction between Gag-VN and Gag-VC (top) or Gag-VN and Staufen1-VC (bottom) was determined by BiFC in Jurkat T cells. Magnified sections demonstrate details on the shapes of BiFC signals/complexes. The size bars are equal to 10 μm.
Figure 2
Figure 2
Interactions between Gag and cellular proteins Staufen1 or IMP1 at GM1 containing lipid rafts on the plasma membrane as determined by BiFC. (A) HeLa cells were co-transfected with pCMV-Rev and Rev-dependent Gag-VN and Gag-VC plasmids. At 24 hr post-transfection lipid raft staining in live cells was performed. Images were captured using laser scanning confocal microscopy to detect the co-localization patterns of oligomerizing Gag molecules and lipid raft microdomains (indicated by CT-B that binds the pentasaccharide chain of the raft marker protein, GM1). (B) Gag-VN/Staufen1-VC BiFC signals and CT-B staining in live cells. (C) Gag-VN/IMP1-VC BiFC signals and CT-B staining in live cells. (D) HeLa cells or (E) Jurkat T cells were co-transfected with pCMV-Rev and Rev-dependent Gag-VN and Gag-VC plasmids. At 24 hr post-transfection the cells were fixed in 4% paraformaldehyde (T cells were attached to poly-D-lysine coated coverslips before fixation), permeabilized in 0.2% Triton and stained for endogenous Staufen1 and p17 to detect Gag (in Jurkat T cells only; (E), Gag is presented in blue). BiFC signals also identify Gag-Gag oligomers in fixed cells. Magnifications of cells on right show endogenous Staufen1 in Gag-Gag BiFC-negative (box 1) and positive (box 2) HeLa (D) or Jurkat T (E) cells. The size bars are equal to 10 μm.
Figure 3
Figure 3
Staufen1 co-fractionates with Gag in lipid rafts. (A) A detergent-free method for the isolation and fractionation of lipid rafts. HeLa cells were mock transfected (B) or co-transfected with pCMV-Rev and Rev-dependent Gag-VN and Gag-VC (C) or Rev-dependent GagΔNC/p6 (D). At 24 hr post-transfection, cells were harvested and fractionated on Optiprep gradients: lipid rafts fractionated in fractions #2-6 and non-membrane associated proteins in the bottom fractions. Western blotting identified Caveolin-1 (Cav-1), Staufen1 (two isoforms: St-55, St-63), IMP1, TSC2, Gag-VC (in C) and p24 (to detect GagΔNC/p6 in (D)) in each fraction. (E) The relative quantities of Staufen1 in each fraction were measured using ImageJ software (NIH) (the sum of all fractions per condition = 1.0).
Figure 4
Figure 4
Time-dependent depletion of cholesterol from lipid rafts leads to the disruption of Gag-Gag, Gag-Staufen1 or Gag-IMP1 BiFC. (A) HeLa cells were co-transfected with pCMV-Rev, Gag-VN and Gag-VC. At 24 hr post-transfection the cells were stained with the Vybrant Lipid Raft Labeling Kit and treated with cholesterol disrupting drug HβCD (final concentration 30 mM). Pictures were taken at the indicated times post-HβCD treatment. (B) HeLa cells were co-transfected with pCMV-Rev and the Rev-dependent Gag [46] and at 24 hr post-transfection were treated with HβCD for different periods of time (as indicated, for up to 45 min). The cells were then fixed, stained for Caveolin-1 and Gag and visualized by laser scanning confocal microscopy. (C) Hela cells were co-transfected with pCMV-Rev and either Gag-VN and Staufen1-VC or Gag-VN (top panels) and IMP1-VC (lower panels). At 24 hr post-transfection lipid rafts were identified in live cells using the Vybrant Lipid Raft Labeling and treated with HβCD for up to 25 min. The BiFC signals were determined at t = 0 (not shown) and at the latest time point of t = 25 min. The size bars are equal to 10 μm.
Figure 5
Figure 5
Staufen1 depletion decreases plasma membrane-associated Gag and results in intracellular clustering of Gag-Gag BiFC signals. HeLa cells were co-transfected with pCMV-Rev, Gag-VN and Gag-VC plasmids with control non-silencing siRNA (siNS), Staufen1 siRNA (siStaufen1) or Staufen1-HA. At 24 hr post-transfection cells were harvested for western blotting for Staufen1, Gag, Caveolin-1 and TSC2 (as loading controls) (A) or stained for lipid rafts in live cells. BiFC signals and lipid raft (CT-B) staining were captured by laser scanning confocal microscopy in cells transfected with siNS (B), siStaufen1 (C) or Staufen1-HA (D). Black and white images of lipid rafts (CT-B) and Gag-Gag BiFC signals and merged colour representations are shown. The insets are magnifications of boxed areas. The size bars are equal to 10 μm.
Figure 6
Figure 6
Gag localizes near Rab7-, Rab9- and LAMP1-containing membranes at cytoplasmic and juxtanuclear sites in Staufen1-depleted cells. HeLa cells were transfected with pCMV-Rev, Gag-VN and Gag-VC with either siNS or siStaufen1 siRNAs and one of the following plasmids: (A) Rab5-RFP, (B) Rab7-RFP, (C) Rab9-RFP, (D) LAMP1-RFP or (E) Caveolin-1-RFP. At 24 hr post-transfection, the distributions of Gag-Gag BiFC and RFP fusion proteins were visualized in live cells by laser scanning confocal microscopy. The insets show zoomed boxed regions of cells to demonstrate the levels of co-localization of Gag-Gag BiFC signals with either of membrane marker proteins. White arrows identify Gag-Gag BiFC aggregates. The size bars are equal to 10 μm.
Figure 7
Figure 7
TriFC analysis for studying RNA-protein interactions in live cells. (A) Depiction of the TriFC analysis employed in the study. The mRNA-reporter molecule contains HIV-1 vRNA packaging signal psi in close proximity to the integrated MS2 RNA-binding site (MS2BS). MS2-VN binds MS2BS to tether to the mRNA molecule. The C-terminal moiety of Venus (VC) is expressed as hGag-VC fusion and binding of hGag-VC to the RNA packaging sequence (psi domain) will bring both VN and VC Venus moieties in close enough proximity to generate a fluorescent signal by VN-VC complementation. (B) A 19-basepair deletion from SL3 of psi prevents the binding between hGag-VC and psi RNA and does not yield fluorescence complementation. (C) HeLa cells were grown on coverslips and transfected with pGL3MS2site-psi, MS2-VN and Gag-VN. 24 hr later laser scanning confocal microscopy was used to assess TriFC. Bright fluorescence signals in cytoplasmic punctae were detected indicating that the interaction between hGag-VC and the psi RNA domain occurred. This condition represented a positive control for the TriFC system employed here. TriFC signals were not detected when HeLa cells were transfected with the mutated psi reporter (pGL3MS2site-Delta-psi) (D). In order to determine the specificity of the TriFC assay, HeLa cells were co-transfected with plasmids expressing either Staufen1-VC (E) or IMP1-VC (F) along with MS2-VN and pGL3MS2site-psi. TriFC was absent in all cells examined indicating that Staufen1 and IMP1 do not bind the psi RNA. In parallel experiments, Gag did not associate with mRNA reporter bearing β-Actin zipcode sequence (pGL3-βActin zipcode) (G) whereas IMP1 did (H), as expected [33]. Phase contrast images are shown on the left of each panel in (C)-(H). The size bars are equal to 10 μm.
Figure 8
Figure 8
Gag recruits host proteins Staufen1 and IMP1 while tethered to mRNA. HeLa cells were co-transfected with mRNA-reporter pGL3-basic/site, MS2-VN, MS2-Gag or MS2-Staufen1 and hGag-VC, Staufen1-VC or IMP-VC as indicated. TriFC analysis was performed at 24 and 40 hr post-transfection. MS2 RNA-tethered hGag recruits Gag (A), Staufen1 (B) and IMP1 (C) to generate TriFC signals in cells. MS2 RNA-tethered Staufen1 recruits hGag (D). Western blotting analysis for Staufen1, p24 (to identify Gag), and GFP (that recognizes C terminal part of Venus) and Luciferase (reporter mRNA, pGL3-basic/site expressed Luciferase) confirmed expression of DNA constructs. Negative controls included transfections that omitted either the VC fusion proteins (bottom left in panels (A)-(D)) or the bridging MS2 molecule (MS2-hGag, MS2-Gag(C36S) or MS2-Staufen1; data not shown). The size bars are equal to 10 μm.

Similar articles

Cited by

References

    1. Goff SP. Host factors exploited by retroviruses. Nat Rev Microbiol. 2007;5:253–263. doi: 10.1038/nrmicro1541. - DOI - PubMed
    1. Freed EO. HIV-1 gag proteins: diverse functions in the virus life cycle. Virology. 1998;251:1–15. doi: 10.1006/viro.1998.9398. - DOI - PubMed
    1. McLaren M, Marsh K, Cochrane A. Modulating HIV-1 RNA processing and utilization. Front Biosci. 2008;13:5693–5707. doi: 10.2741/3110. - DOI - PubMed
    1. Cochrane AW, McNally MT, Mouland AJ. The retrovirus RNA trafficking granule: from birth to maturity. Retrovirology. 2006;3:18. doi: 10.1186/1742-4690-3-18. - DOI - PMC - PubMed
    1. Swanson CM, Puffer BA, Ahmad KM, Doms RW, Malim MH. Retroviral mRNA nuclear export elements regulate protein function and virion assembly. EMBO J. 2004;23:2632–2640. doi: 10.1038/sj.emboj.7600270. - DOI - PMC - PubMed

Publication types

MeSH terms

Substances