

Ultra-high throughput sequencing-based small RNA discovery and discrete statistical biomarker analysis in a collection of cervical tumours and matched controls
- PMID: 20459774
- PMCID: PMC2880020
- DOI: 10.1186/1741-7007-8-58
Ultra-high throughput sequencing-based small RNA discovery and discrete statistical biomarker analysis in a collection of cervical tumours and matched controls
Abstract
Background: Ultra-high throughput sequencing technologies provide opportunities both for discovery of novel molecular species and for detailed comparisons of gene expression patterns. Small RNA populations are particularly well suited to this analysis, as many different small RNAs can be completely sequenced in a single instrument run.
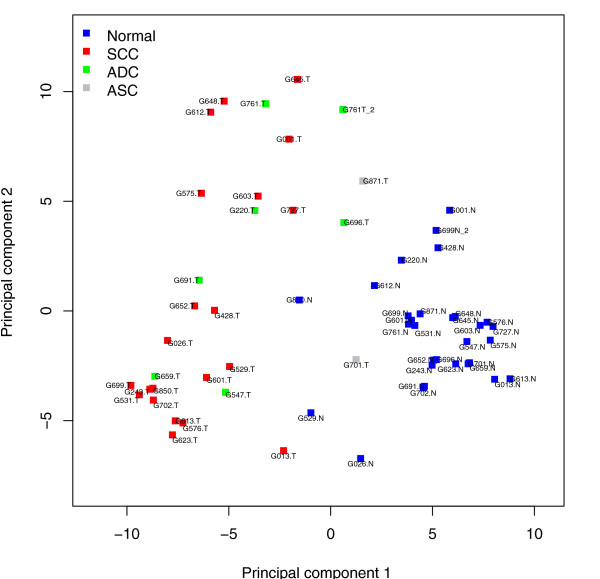
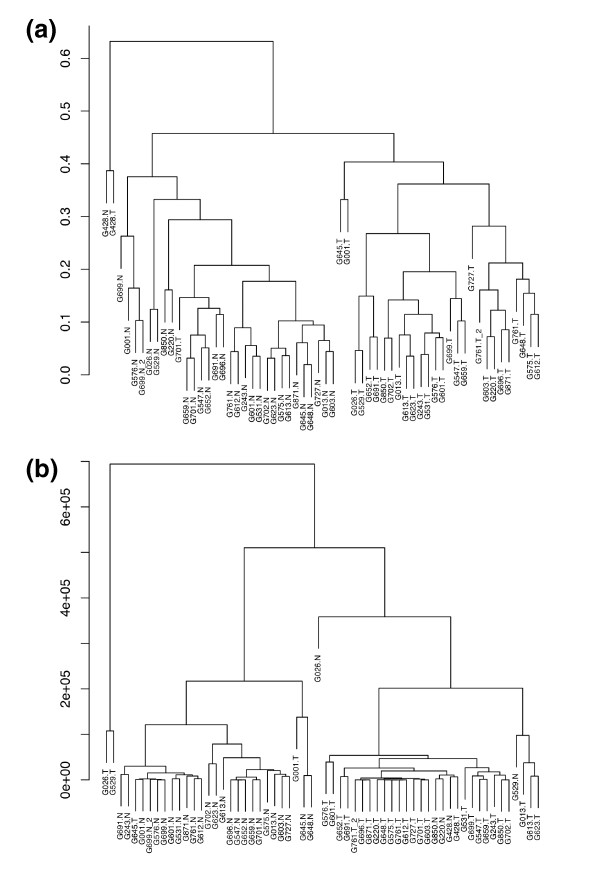
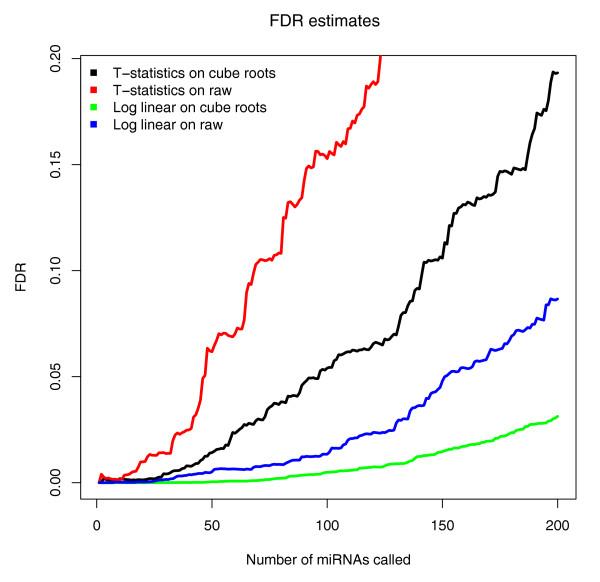
Results: We prepared small RNA libraries from 29 tumour/normal pairs of human cervical tissue samples. Analysis of the resulting sequences (42 million in total) defined 64 new human microRNA (miRNA) genes. Both arms of the hairpin precursor were observed in twenty-three of the newly identified miRNA candidates. We tested several computational approaches for the analysis of class differences between high throughput sequencing datasets and describe a novel application of a log linear model that has provided the most effective analysis for this data. This method resulted in the identification of 67 miRNAs that were differentially-expressed between the tumour and normal samples at a false discovery rate less than 0.001.
Conclusions: This approach can potentially be applied to any kind of RNA sequencing data for analysing differential sequence representation between biological sample sets.
Figures
Similar articles
-
Identification of Taxus microRNAs and their targets with high-throughput sequencing and degradome analysis.Physiol Plant. 2012 Dec;146(4):388-403. doi: 10.1111/j.1399-3054.2012.01668.x. Epub 2012 Jul 25. Physiol Plant. 2012. PMID: 22708792
-
Parallel DNA pyrosequencing unveils new zebrafish microRNAs.BMC Genomics. 2009 Apr 27;10:195. doi: 10.1186/1471-2164-10-195. BMC Genomics. 2009. PMID: 19397817 Free PMC article.
-
MicroRNA Expression Analysis: Next-Generation Sequencing.Methods Mol Biol. 2018;1783:171-183. doi: 10.1007/978-1-4939-7834-2_8. Methods Mol Biol. 2018. PMID: 29767362
-
Discovery of new microRNAs by small RNAome deep sequencing in childhood acute lymphoblastic leukemia.Leukemia. 2011 Sep;25(9):1389-99. doi: 10.1038/leu.2011.105. Epub 2011 May 24. Leukemia. 2011. PMID: 21606961 Review.
-
Computational analysis of small RNA cloning data.Methods. 2008 Jan;44(1):13-21. doi: 10.1016/j.ymeth.2007.10.002. Methods. 2008. PMID: 18158128 Review.
Cited by
-
NBLDA: negative binomial linear discriminant analysis for RNA-Seq data.BMC Bioinformatics. 2016 Sep 13;17(1):369. doi: 10.1186/s12859-016-1208-1. BMC Bioinformatics. 2016. PMID: 27623864 Free PMC article.
-
Fine-tuning of microRNA-mediated repression of mRNA by splicing-regulated and highly repressive microRNA recognition element.BMC Genomics. 2013 Jul 3;14:438. doi: 10.1186/1471-2164-14-438. BMC Genomics. 2013. PMID: 23819653 Free PMC article.
-
The analytical landscape of static and temporal dynamics in transcriptome data.Front Genet. 2014 Feb 20;5:35. doi: 10.3389/fgene.2014.00035. eCollection 2014. Front Genet. 2014. PMID: 24600473 Free PMC article. Review.
-
Machine Learning Made Easy (MLme): a comprehensive toolkit for machine learning-driven data analysis.Gigascience. 2024 Jan 2;13:giad111. doi: 10.1093/gigascience/giad111. Gigascience. 2024. PMID: 38206587 Free PMC article.
-
Novel tumor suppressor microRNA at frequently deleted chromosomal region 8p21 regulates epidermal growth factor receptor in prostate cancer.Oncotarget. 2016 Oct 25;7(43):70388-70403. doi: 10.18632/oncotarget.11865. Oncotarget. 2016. PMID: 27611943 Free PMC article.
References
Publication types
MeSH terms
Substances
Grants and funding
LinkOut - more resources
Full Text Sources
Other Literature Sources
Molecular Biology Databases
