

Trypsin-induced proteome alteration during cell subculture in mammalian cells
- PMID: 20459778
- PMCID: PMC2873939
- DOI: 10.1186/1423-0127-17-36
Trypsin-induced proteome alteration during cell subculture in mammalian cells
Abstract
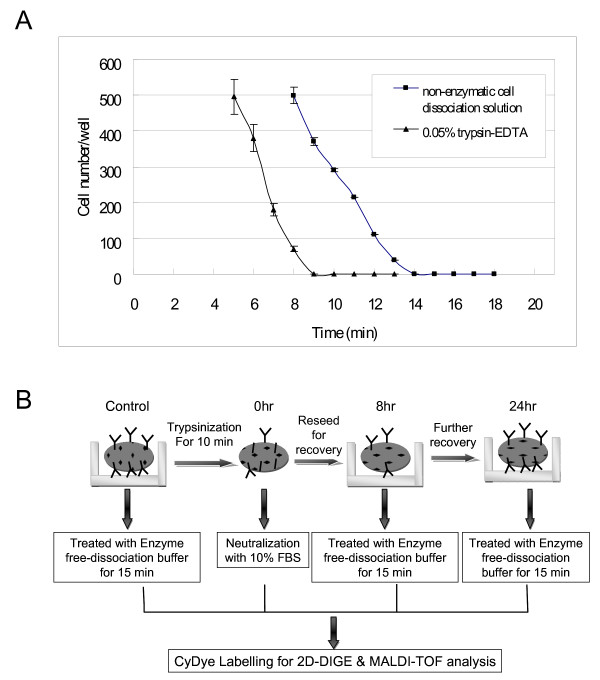
Background: It is essential to subculture the cells once cultured cells reach confluence. For this, trypsin is frequently applied to dissociate adhesive cells from the substratum. However, due to the proteolytic activity of trypsin, cell surface proteins are often cleaved, which leads to dysregulation of the cell functions.
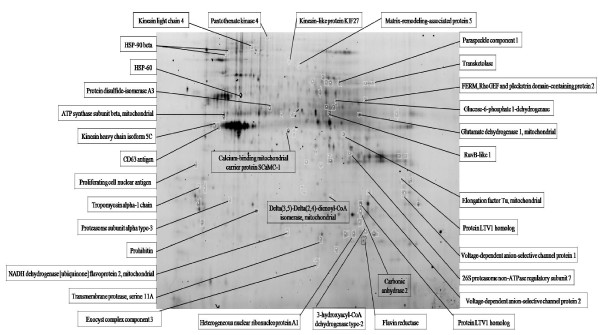
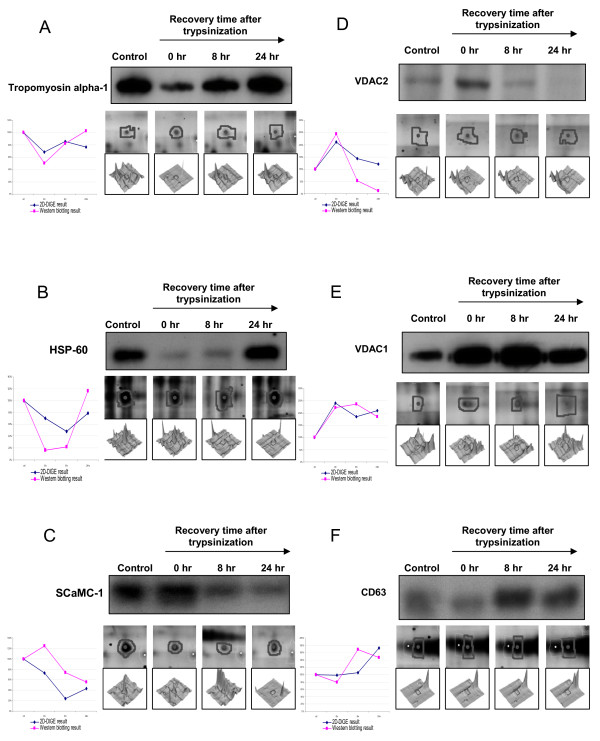
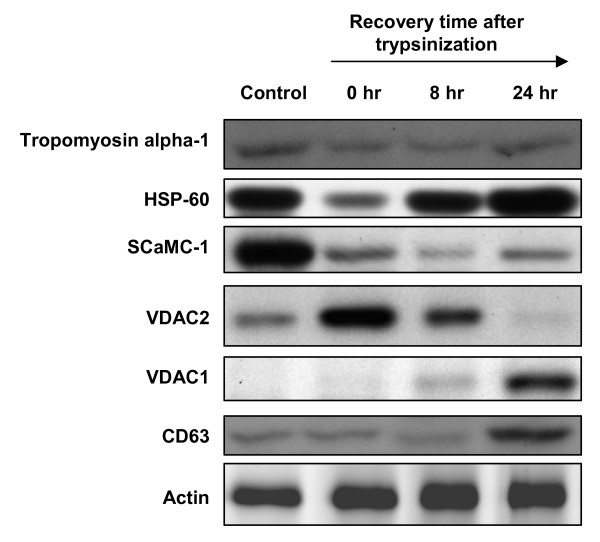
Methods: In this study, a triplicate 2D-DIGE strategy has been performed to monitor trypsin-induced proteome alterations. The differentially expressed spots were identified by MALDI-TOF MS and validated by immunoblotting.
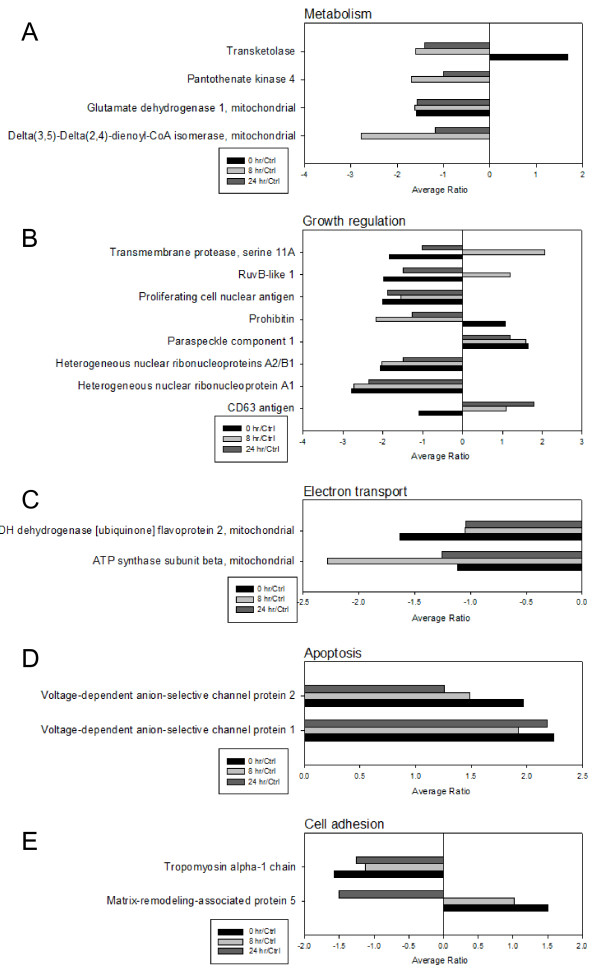
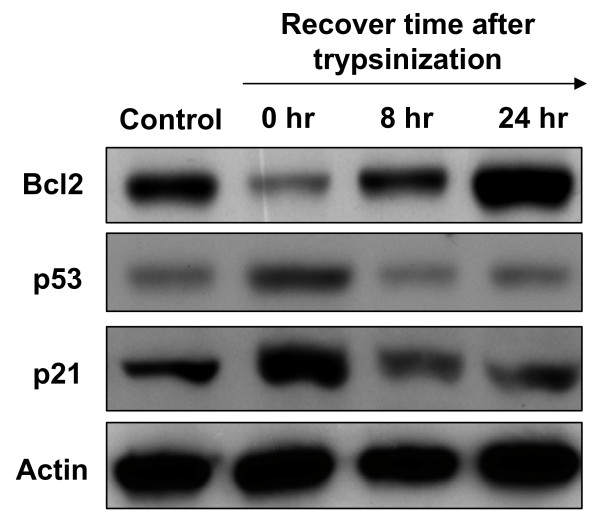
Results: 36 proteins are found to be differentially expressed in cells treated with trypsin, and proteins that are known to regulate cell metabolism, growth regulation, mitochondrial electron transportation and cell adhesion are down-regulated and proteins that regulate cell apoptosis are up-regulated after trypsin treatment. Further study shows that bcl-2 is down-regulated, p53 and p21 are both up-regulated after trypsinization.
Conclusions: In summary, this is the first report that uses the proteomic approach to thoroughly study trypsin-induced cell physiological changes and provides researchers in carrying out their experimental design.
Figures
Similar articles
-
Secretomic and proteomic analysis of potential breast cancer markers by two-dimensional differential gel electrophoresis.J Proteome Res. 2010 Mar 5;9(3):1302-22. doi: 10.1021/pr900825t. J Proteome Res. 2010. PMID: 20052998
-
Potential predictive plasma biomarkers for cervical cancer by 2D-DIGE proteomics and Ingenuity Pathway Analysis.Tumour Biol. 2015 Mar;36(3):1711-20. doi: 10.1007/s13277-014-2772-5. Epub 2014 Nov 27. Tumour Biol. 2015. PMID: 25427637
-
Mitochondrial proteomics with siRNA knockdown to reveal ACAT1 and MDH2 in the development of doxorubicin-resistant uterine cancer.J Cell Mol Med. 2015 Apr;19(4):744-59. doi: 10.1111/jcmm.12388. Epub 2015 Jan 30. J Cell Mol Med. 2015. PMID: 25639359 Free PMC article.
-
Characterization of proteins in human pancreatic cancer serum using differential gel electrophoresis and tandem mass spectrometry.J Proteome Res. 2005 Sep-Oct;4(5):1742-51. doi: 10.1021/pr050174l. J Proteome Res. 2005. PMID: 16212428
-
Identification of Up- and Down-Regulated Proteins in Pemetrexed-Resistant Human Lung Adenocarcinoma: Flavin Reductase and Calreticulin Play Key Roles in the Development of Pemetrexed-Associated Resistance.J Proteome Res. 2015 Nov 6;14(11):4907-20. doi: 10.1021/acs.jproteome.5b00794. Epub 2015 Oct 22. J Proteome Res. 2015. PMID: 26452990
Cited by
-
Characterization of growth suppressive functions of a splice variant of cyclin D2.PLoS One. 2013;8(1):e53503. doi: 10.1371/journal.pone.0053503. Epub 2013 Jan 10. PLoS One. 2013. PMID: 23326442 Free PMC article.
-
Spatial mapping of the biologic effectiveness of scanned particle beams: towards biologically optimized particle therapy.Sci Rep. 2015 May 18;5:9850. doi: 10.1038/srep09850. Sci Rep. 2015. PMID: 25984967 Free PMC article.
-
A safe and efficient method to retrieve mesenchymal stem cells from three-dimensional fibrin gels.Tissue Eng Part C Methods. 2014 Mar;20(3):252-63. doi: 10.1089/ten.TEC.2013.0051. Epub 2013 Aug 14. Tissue Eng Part C Methods. 2014. PMID: 23808842 Free PMC article.
-
Optimization of Protocol for Isolation of Chondrocytes from Human Articular Cartilage.Cartilage. 2021 Dec;13(2_suppl):872S-884S. doi: 10.1177/1947603519876333. Epub 2019 Sep 20. Cartilage. 2021. PMID: 31540551 Free PMC article.
-
RNA-sequencing from single nuclei.Proc Natl Acad Sci U S A. 2013 Dec 3;110(49):19802-7. doi: 10.1073/pnas.1319700110. Epub 2013 Nov 18. Proc Natl Acad Sci U S A. 2013. PMID: 24248345 Free PMC article.
References
-
- Peralta SA, Knudsen KA, Tecson-Miguel A, McBrearty FX, Han AC, Salazar H. Expression of E-cadherin and N-cadherin in surface epithelial-stromal tumors of the ovary distinguishes mucinous from serous and endometrioid tumors. Hum Pathol. 1997;28:734–739. doi: 10.1016/S0046-8177(97)90184-2. - DOI - PubMed
-
- Lee JW, Soung YH, Kim SY, Park WS, Nam SW, Kim SH, Lee JY, Yoo NJ, Lee SH. ERBB2 kinase domain mutation in a gastric cancer metastasis. APMIS. 2005;113:683–687. - PubMed
Publication types
MeSH terms
Substances
LinkOut - more resources
Full Text Sources
Other Literature Sources
Research Materials
Miscellaneous
