Comparative Study
. 2010 May 11;12(1):26.
doi: 10.1186/1532-429X-12-26.

Measuring aortic pulse wave velocity using high-field cardiovascular magnetic resonance: comparison of techniques

Affiliations
Comparative Study

Measuring aortic pulse wave velocity using high-field cardiovascular magnetic resonance: comparison of techniques

El-Sayed H Ibrahim et al. J Cardiovasc Magn Reson. .

Abstract

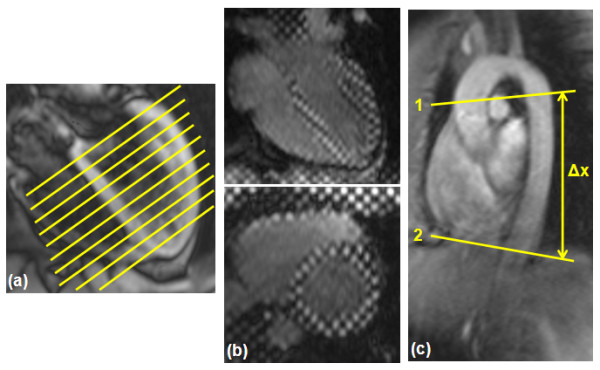
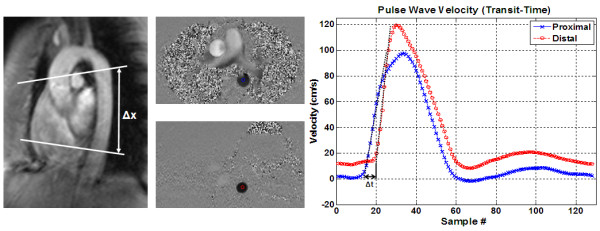
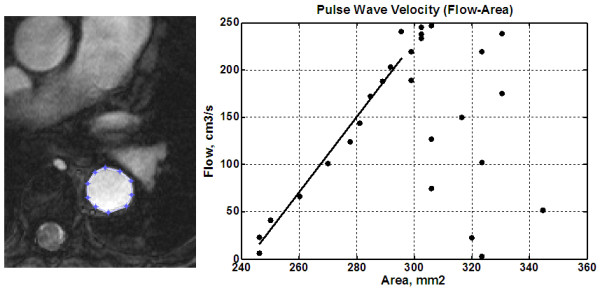
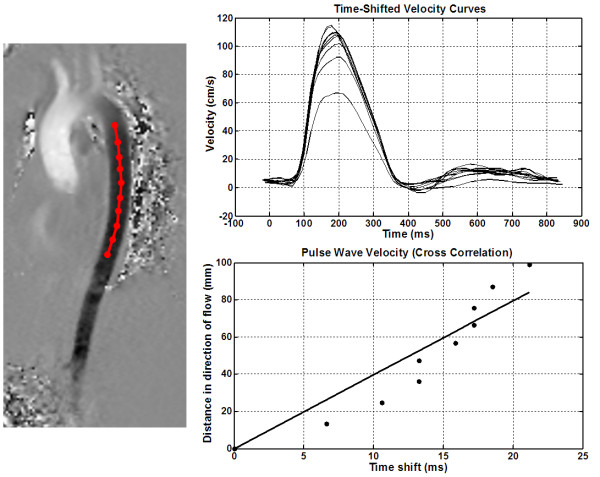
Background: The assessment of arterial stiffness is increasingly used for evaluating patients with different cardiovascular diseases as the mechanical properties of major arteries are often altered. Aortic stiffness can be noninvasively estimated by measuring pulse wave velocity (PWV). Several methods have been proposed for measuring PWV using velocity-encoded cardiovascular magnetic resonance (CMR), including transit-time (TT), flow-area (QA), and cross-correlation (XC) methods. However, assessment and comparison of these techniques at high field strength has not yet been performed. In this work, the TT, QA, and XC techniques were clinically tested at 3 Tesla and compared to each other.

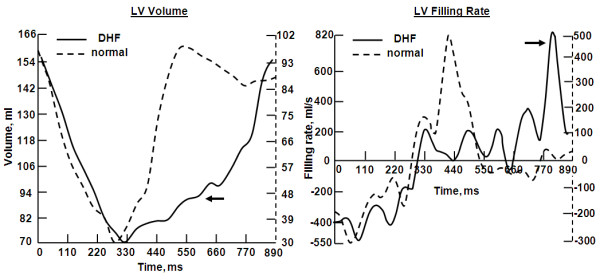
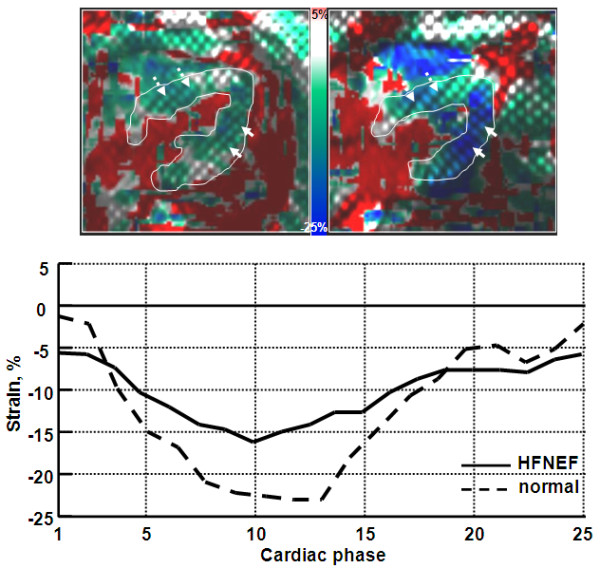
Methods: Fifty cardiovascular patients and six volunteers were scanned to acquire the necessary images. The six volunteer scans were performed twice to test inter-scan reproducibility. Patient images were analyzed using the TT, XC, and QA methods to determine PWV. Two observers analyzed the images to determine inter-observer and intra-observer variabilities. The PWV measurements by the three methods were compared to each other to test inter-method variability. To illustrate the importance of PWV using CMR, the degree of aortic stiffness was assessed using PWV and related to LV dysfunction in five patients with diastolic heart failure patients and five matched volunteers.

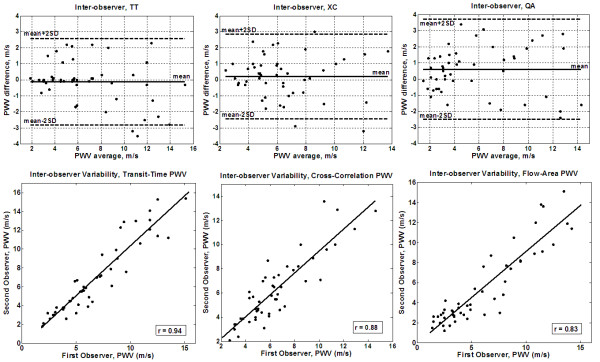
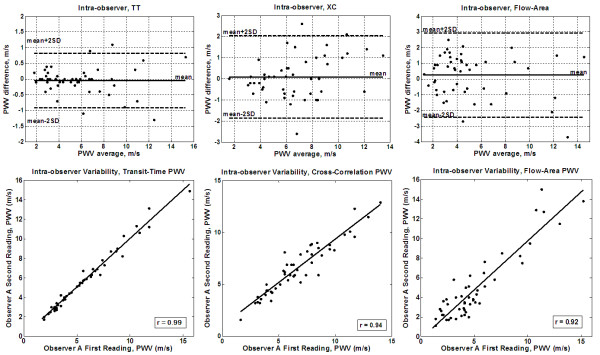
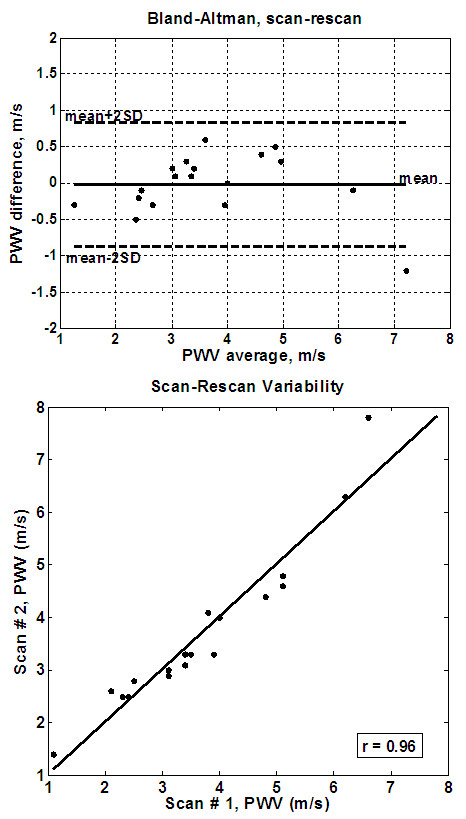
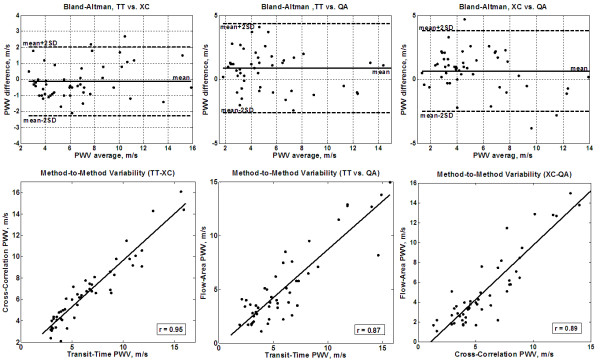
Results: The inter-observer and intra-observer variability results showed no bias between the different techniques. The TT and XC results were more reproducible than the QA; the mean (SD) inter-observer/intra-observer PWV differences were -0.12(1.3)/-0.04(0.4) for TT, 0.2(1.3)/0.09(0.9) for XC, and 0.6(1.6)/0.2(1.4) m/s for QA methods, respectively. The correlation coefficients (r) for the inter-observer/intra-observer comparisons were 0.94/0.99, 0.88/0.94, and 0.83/0.92 for the TT, XC, and QA methods, respectively. The inter-scan reproducibility results showed low variability between the repeated scans (mean (SD) PWV difference = -0.02(0.4) m/s and r = 0.96). The inter-method variability results showed strong correlation between the TT and XC measurements, but less correlation with QA: r = 0.95, 0.87, and 0.89, and mean (SD) PWV differences = -0.12(1.0), 0.8(1.7), and 0.65(1.6) m/s for TT-XC, TT-QA, and XC-QA, respectively. Finally, in the group of diastolic heart failure patient, PWV was significantly higher (6.3 +/- 1.9 m/s) than in volunteers (3.5 +/- 1.4 m/s), and the degree of LV diastolic dysfunction showed good correlation with aortic PWV.

Conclusions: In conclusion, while each of the studied methods has its own advantages and disadvantages, at high field strength, the TT and XC methods result in closer and more reproducible aortic PWV measurements, and the associated image processing requires less user interaction, than in the QA method. The choice of the analysis technique depends on the vessel segment geometry and available image quality.


Figures

Figure 1
Figure 1
Acquired CMR images. Three sets of CMR images are acquired for the diastolic heart failure patients: (a) a stack of parallel short-axis cine images covering the left ventricle from base to apex to measure the filling pattern and myocardial thickness. (b) Four-chamber (up) and short-axis (down) cine tagged images to measure myocardial strain. (c) Two velocity-encoded aortic cross sections, separated by distance Δx to measure the pulse wave velocity.
Figure 2
Figure 2
Transit-time method for calculating PWV. Velocity curves (right) from a volunteer scan are computed at two distant cross sections (middle) along the descending aorta (left). PWV = Δx/Δt, where Δx is the distance between the two locations and Δt is the time difference between the two velocity curves.
Figure 3
Figure 3
Flow-area method. PWV results from a volunteer scan. A cross section of the aorta is shown (left), where the user marks the aorta boundary. The panel on the right shows the change in aortic cross sectional area versus total flow at different frames in the cardiac cycle. A line is fitted to the data during the initial slope of the curve at early systole, from which PWV is calculated. After systole, ROIs were drawn large to separate them from earlier points and avoid confounding the linear fit.
Figure 4
Figure 4
Cross-correlation method. Flow patterns (up) from a volunteer scan are computed at several points along the descending aortic path (left). Cross correlation is used to estimate the time shift between consecutive points. Linear least-square fitting is used to calculate PWV (down).
Figure 5
Figure 5
Inter-observer variability. Bland-Altman (up) and regression analysis (down) are shown for transit-time (left), cross-correlation (middle), and flow-area (right) methods on the patients' cohort. The transit-time and cross-correlation methods result in better agreements than the flow-area method.
Figure 6
Figure 6
Intra-observer variability. Bland-Altman (up) and regression analysis (down) are shown for transit-time (left), cross-correlation (middle), and flow-area (right) methods on the patients' cohort. The transit-time and cross-correlation methods result in better agreements than the flow-area method.
Figure 7
Figure 7
Inter-scan variability. Bland-Altman (up) and regression analysis (down) are shown on the volunteers' cohort. There is large agreement between the repeated scans.
Figure 8
Figure 8
Inter-method variability. Bland-Altman (up) and regression analysis (down) are shown for transit-time vs. cross-correlation (left), transit-time vs. flow-area (middle), and cross-correlation vs. flow-area (right) methods on the patients' cohort. The transit-time and cross-correlation methods have large agreement together than with the flow-area method.
Figure 9
Figure 9
LV volume and filling rate in diastolic heart failure. LV volume (left) and filling rate (right) for a diastolic heart failure patient (solid) and a healthy volunteer (dashed). Diastolic heart failure is characterized by a major filling component at the late atrial phase compared to early filling phase (arrows).
Figure 10
Figure 10
LV end-diastolic thickness in diastolic heart failure. Bull's eye figures of end-diastolic thickness in diastolic heart failure (left) and normal (right) computed from a stack of cine short-axis images.
Figure 11
Figure 11
LV myocardial strain in diastolic heart failure. The left and right images show (longitudinal) myocardial strains overlaid on four-chamber tagged images at end-systole for diastolic heart failure and normal subjects, respectively. LV is manually traced for clarity. Solid and dashed arrows point to LV free wall and septum, respectively. The curves show longitudinal strain values through the cardiac cycle for patients (solid) and normals (dashed). Diastolic heart failure is characterized by a small strain dynamic range (difference between end-systolic and end-diastolic strains) and less relaxation during diastole, compared to normal.

References

    1. Dobrin PB. Mechanical properties of arteries. Physiol Rev. 1978;58:397–460. - PubMed
    1. Peterson LH, Jensen RE, Parnell J. Mechanical properties of arteries in vivo. Circ Res. 1960;8:622–639.
    1. Imura T, Yamamoto K, Satoh T, Kanamori K, Mikami T, Yasuda H. In vivo viscoelastic behavior in the human aorta. Circ Res. 1990;66:1413–1419. - PubMed
    1. Metafratzi ZM, Efremidis SC, Skopelitou AS, De Roos A. The clinical significance of aortic compliance and its assessment with magnetic resonance imaging. J Cardiovasc Magn Reson. 2002;4:481–491. doi: 10.1081/JCMR-120016386. - DOI - PubMed
    1. Laurent S, Cockcroft J, Van Bortel L, Boutouyrie P, Giannattasio C, Hayoz D, Pannier B, Vlachopoulos C, Wilkinson I, Struijker-Boudier H. Expert consensus document on arterial stiffness: methodological issues and clinical applications. Eur Heart J. 2006;27:2588–2605. doi: 10.1093/eurheartj/ehl254. - DOI - PubMed

Publication types