. 2010;11(5):R50.
doi: 10.1186/gb-2010-11-5-r50. Epub 2010 May 11.

Modeling non-uniformity in short-read rates in RNA-Seq data

Affiliations

Modeling non-uniformity in short-read rates in RNA-Seq data

Jun Li et al. Genome Biol. 2010.

Abstract

After mapping, RNA-Seq data can be summarized by a sequence of read counts commonly modeled as Poisson variables with constant rates along each transcript, which actually fit data poorly. We suggest using variable rates for different positions, and propose two models to predict these rates based on local sequences. These models explain more than 50% of the variations and can lead to improved estimates of gene and isoform expressions for both Illumina and Applied Biosystems data.


Figures
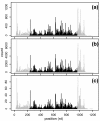
Figure 1
Figure 1
Counts of reads along gene Apoe in different tissues of the Wold data. (a) Brain, (b) liver, (c) skeletal muscle. Each vertical line stands for the count of reads starting at that position. The grey lines are counts in the UTR regions and a further 100 bp. Here introns are deleted and exons are connected into a single piece. Only shown are counts on one strand of the gene; counts on the other strand show similar similarities in different tissues. Nt: nucleotides.
Figure 2
Figure 2
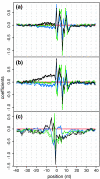
The coefficients of the Poisson linear models in different datasets. The coefficients of the Poisson linear model in the eight sub-datasets when we consider surrounding sequences as 40 nucleotides before and 40 nucleotides after the first nucleotide of a read. Position -1, 0, 1 means the nucleotide before the first nucleotide of a read, the first nucleotide of a read, and the second nucleotide of a read, respectively. Color coding for nucleotides: red, T; green, A; blue, C; black, G. The coefficients for nucleotide T (red) are the base levels, so they are always zero. (a) Coefficients in the Wold data. Shape coding for sub-datasets: rectangle, brain; triangle, liver; circle, skeletal muscle. (b) Coefficients in the Burge data. Shape coding for sub-datasets: rectangle, group 1; triangle, group 2; circle, group 3. (c) Coefficients in the Grimmond data. Shape coding for sub-datasets: rectangle, EB; triangle, ES. Following are examples of how these coefficients should be read. In the Wold brain data, the coefficient of C in the first nucleotide of a read (the blue rectangle at position 0 in (a)) is 0.82. This means that if the nucleotide T is replaced by C, then the sequencing preference will increase to e0.82 = 2.27 times. Nt: nucleotides.
Figure 3
Figure 3
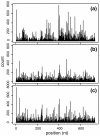
Fitting counts for the Apoe gene. Black vertical lines represent counts (experimental values or fitted values) along the Apoe gene (with the UTR and a further 100 nucleotides truncated). (a) Counts of reads (true values) in the Wold brain data. This is the same as the central part (black vertical lines) of Figure 1a. (b) Counts of fitted reads using the Poisson linear model. We use the other 99 genes of the top 100 genes to train the linear model, which is then used to predict the counts for Apoe. This prediction has a (cross-validation) R2 = 0.54. (c) Counts of fitted reads using MART. We use the other 99 genes of the top 100 genes to train MART, which is then used to predict the counts for Apoe. This prediction has a (cross-validation) R2 = 0.69.
Figure 4
Figure 4
Boxplot of R2 for unique genes in the Wold brain data. We divided the genes with at least one read into six groups according to their RPKMs: <1, 1 to 5, 5 to 15, 15 to 30, 30 to 100, and >100; each group contains 4,205, 3,320, 2,807, 1,330, 1,094, and 383 genes, respectively. Note that in these data, 1 RPKM stands for 0.034 reads per nucleotide on average, a gene with RPKM >30 is considered to be relatively abundant, and a gene with RPKM <1 is not robust even for transcript detection [7].
Figure 5
Figure 5
Four isoforms of RefSeq gene Clta in mouse. This figure was generated using the CisGenome browser [36]. At the top are shown the base positions in mouse chromosome 4 and exons as grey blocks. On the bottom are shown the four isoforms, with exons zoomed in. The tail of exon 1 of the first isoform is 6 bp less than that of the other three isoforms. The second isoform has 7 exons, while the third isoform misses both exon 5 (54 bp) and exon 6 (36 bp), and the fourth isoform misses exon 6.

References

    1. Okoniewski MJ, Miller CJ. Hybridization interactions between probesets in short oligo microarrays lead to spurious correlations. BMC Bioinformatics. 2006;7:276. doi: 10.1186/1471-2105-7-276. - DOI - PMC - PubMed
    1. Royce TE, Rozowsky JS, Gerstein MB. Toward a universal microarray: prediction of gene expression through nearest-neighbor probe sequence identification. Nucleic Acids Res. 2007;35:e99. doi: 10.1093/nar/gkm549. - DOI - PMC - PubMed
    1. Wang Z, Gerstein M, Snyder M. RNA-Seq: a revolutionary tool for transcriptomics. Nat Rev Genet. 2009;10:57–63. doi: 10.1038/nrg2484. - DOI - PMC - PubMed
    1. Holt RA, Jones SJ. The new paradigm of flow cell sequencing. Genome Res. 2008;18:839–846. doi: 10.1101/gr.073262.107. - DOI - PubMed
    1. Nagalakshmi U, Wang Z, Waern K, Shou C, Raha D, Gerstein M, Snyder M. The transcriptional landscape of the yeast genome defined by RNA sequencing. Science. 2008;320:1344–1349. doi: 10.1126/science.1158441. - DOI - PMC - PubMed

Publication types