

Evolution of metabolic network organization
- PMID: 20459825
- PMCID: PMC2876064
- DOI: 10.1186/1752-0509-4-59
Evolution of metabolic network organization
Abstract
Background: Comparison of metabolic networks across species is a key to understanding how evolutionary pressures shape these networks. By selecting taxa representative of different lineages or lifestyles and using a comprehensive set of descriptors of the structure and complexity of their metabolic networks, one can highlight both qualitative and quantitative differences in the metabolic organization of species subject to distinct evolutionary paths or environmental constraints.
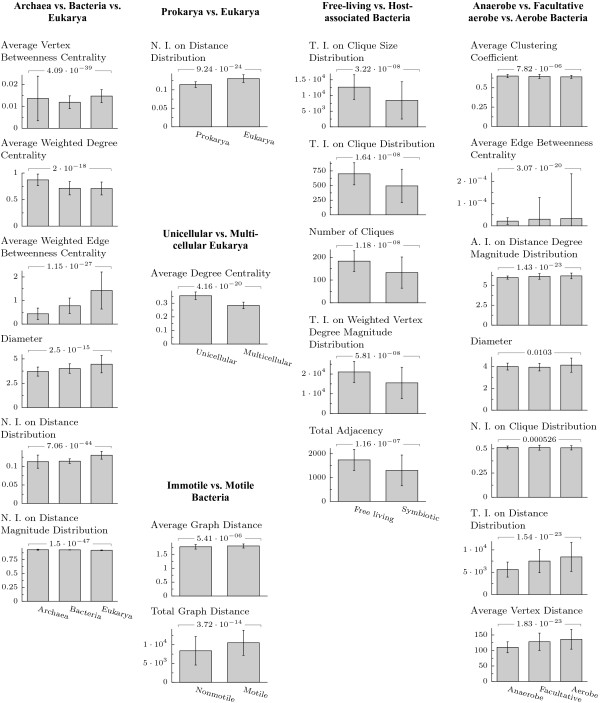
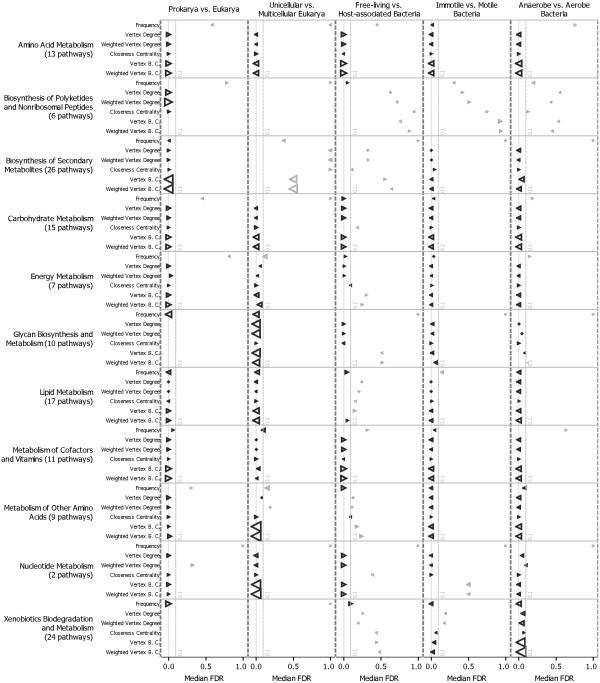
Results: We used a novel representation of metabolic networks, termed network of interacting pathways or NIP, to focus on the modular, high-level organization of the metabolic capabilities of the cell. Using machine learning techniques we identified the most relevant aspects of cellular organization that change under evolutionary pressures. We considered the transitions from prokarya to eukarya (with a focus on the transitions among the archaea, bacteria and eukarya), from unicellular to multicellular eukarya, from free living to host-associated bacteria, from anaerobic to aerobic, as well as the acquisition of cell motility or growth in an environment of various levels of salinity or temperature. Intuitively, we expect organisms with more complex lifestyles to have more complex and robust metabolic networks. Here we demonstrate for the first time that such organisms are not only characterized by larger, denser networks of metabolic pathways but also have more efficiently organized cross communications, as revealed by subtle changes in network topology. These changes are unevenly distributed among metabolic pathways, with specific categories of pathways being promoted to more central locations as an answer to environmental constraints.
Conclusions: Combining methods from graph theory and machine learning, we have shown here that evolutionary pressures not only affects gene and protein sequences, but also specific details of the complex wiring of functional modules in the cell. This approach allows the identification and quantification of those changes, and provides an overview of the evolution of intracellular systems.
Figures
Similar articles
-
Environmental versatility promotes modularity in genome-scale metabolic networks.BMC Syst Biol. 2011 Aug 24;5:135. doi: 10.1186/1752-0509-5-135. BMC Syst Biol. 2011. PMID: 21864340 Free PMC article.
-
Phylogeny of metabolic networks: a spectral graph theoretical approach.J Biosci. 2015 Oct;40(4):799-808. doi: 10.1007/s12038-015-9562-0. J Biosci. 2015. PMID: 26564980
-
Network legos: building blocks of cellular wiring diagrams.J Comput Biol. 2008 Sep;15(7):829-44. doi: 10.1089/cmb.2007.0139. J Comput Biol. 2008. PMID: 18707557
-
Integrative approaches for finding modular structure in biological networks.Nat Rev Genet. 2013 Oct;14(10):719-32. doi: 10.1038/nrg3552. Nat Rev Genet. 2013. PMID: 24045689 Free PMC article. Review.
-
Biological impacts and context of network theory.J Exp Biol. 2007 May;210(Pt 9):1548-58. doi: 10.1242/jeb.003731. J Exp Biol. 2007. PMID: 17449819 Review.
Cited by
-
Recognition of DNA by the helix-turn-helix global regulatory protein Lrp is modulated by the amino terminus.J Bacteriol. 2011 Aug;193(15):3794-803. doi: 10.1128/JB.00191-11. Epub 2011 Jun 3. J Bacteriol. 2011. PMID: 21642464 Free PMC article.
-
Using graph theory to analyze biological networks.BioData Min. 2011 Apr 28;4:10. doi: 10.1186/1756-0381-4-10. BioData Min. 2011. PMID: 21527005 Free PMC article.
-
Analysis of metabolic evolution in bacteria using whole-genome metabolic models.J Comput Biol. 2013 Oct;20(10):755-64. doi: 10.1089/cmb.2013.0079. Epub 2013 Aug 31. J Comput Biol. 2013. PMID: 23992299 Free PMC article.
-
Natural selection retains overrepresented out-of-frame stop codons against frameshift peptides in prokaryotes.BMC Genomics. 2010 Sep 9;11:491. doi: 10.1186/1471-2164-11-491. BMC Genomics. 2010. PMID: 20828396 Free PMC article.
-
Parallel clustering algorithm for large-scale biological data sets.PLoS One. 2014 Apr 4;9(4):e91315. doi: 10.1371/journal.pone.0091315. eCollection 2014. PLoS One. 2014. PMID: 24705246 Free PMC article.
References
Publication types
MeSH terms
Grants and funding
LinkOut - more resources
Full Text Sources
