. 2010 Aug 1;344(1):107-18.
doi: 10.1016/j.ydbio.2010.04.023. Epub 2010 May 9.

Interplay between Foxd3 and Mitf regulates cell fate plasticity in the zebrafish neural crest

Affiliations

Interplay between Foxd3 and Mitf regulates cell fate plasticity in the zebrafish neural crest

Kevin Curran et al. Dev Biol. .

Abstract

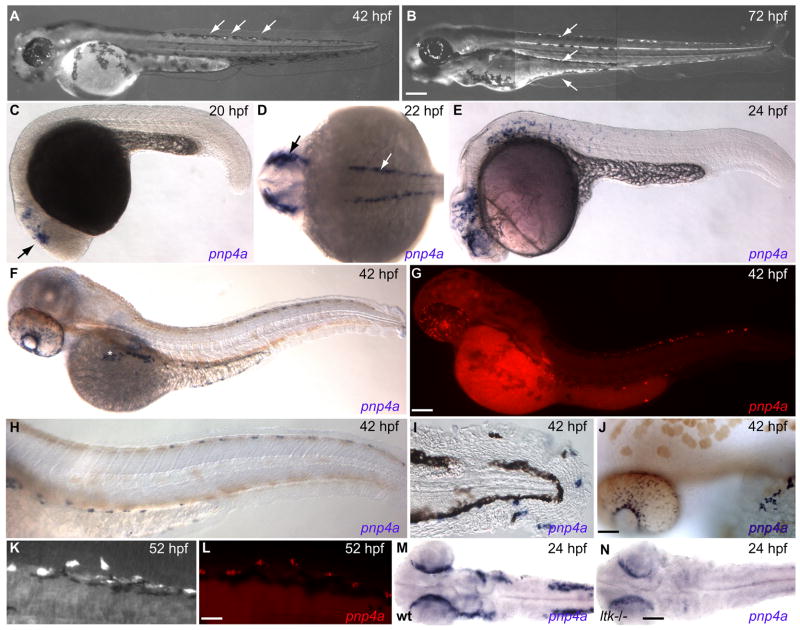
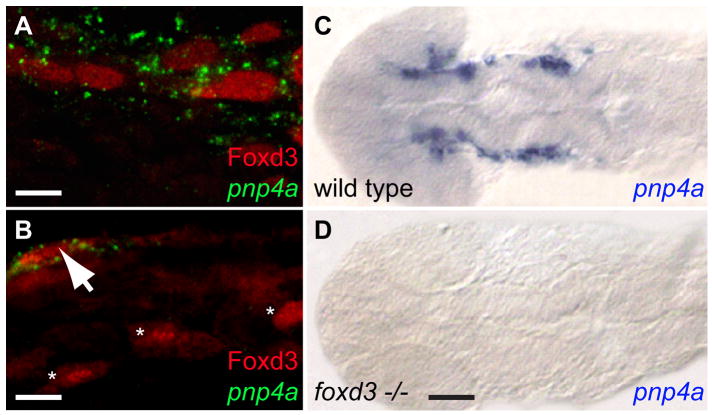
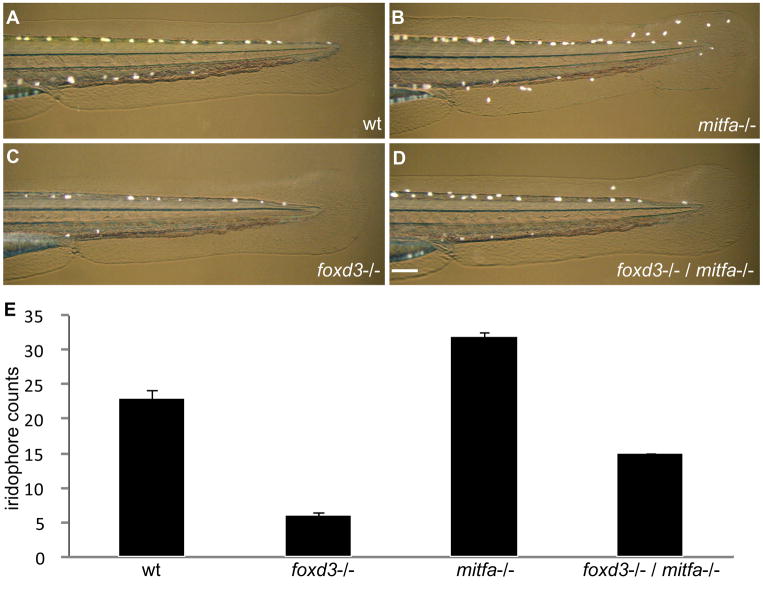
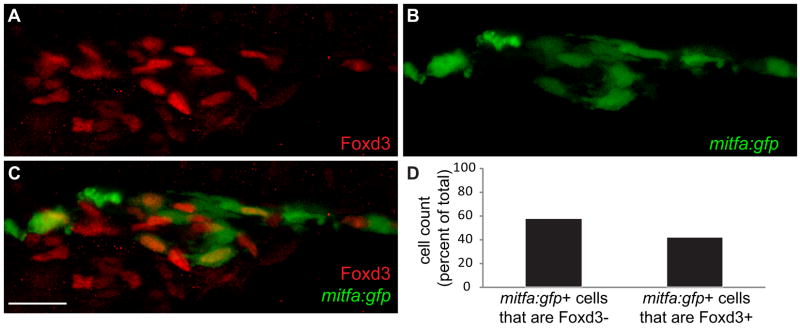
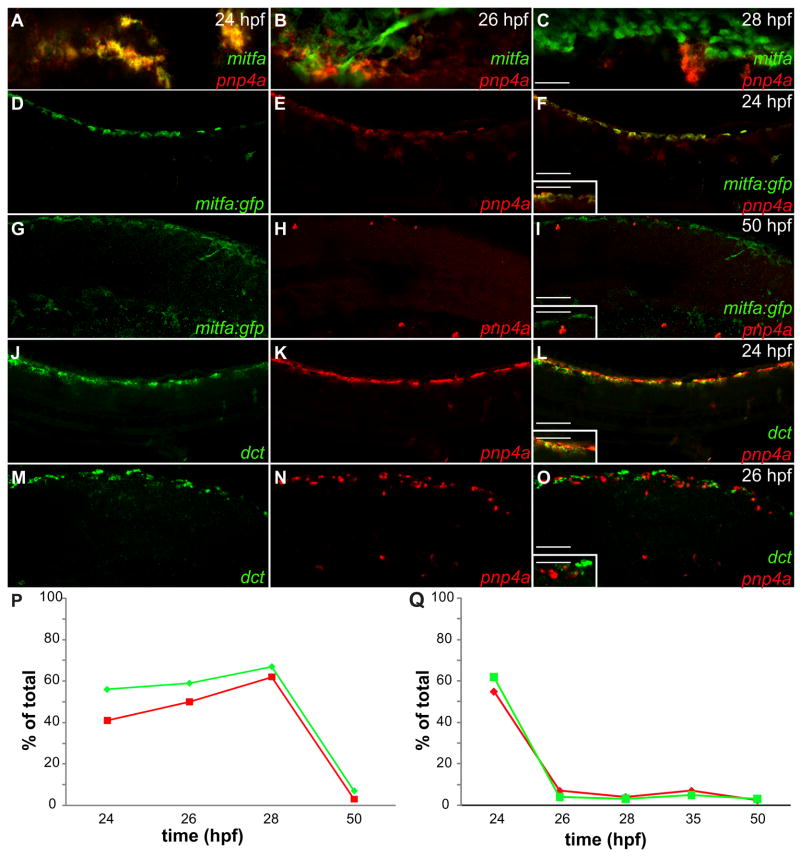
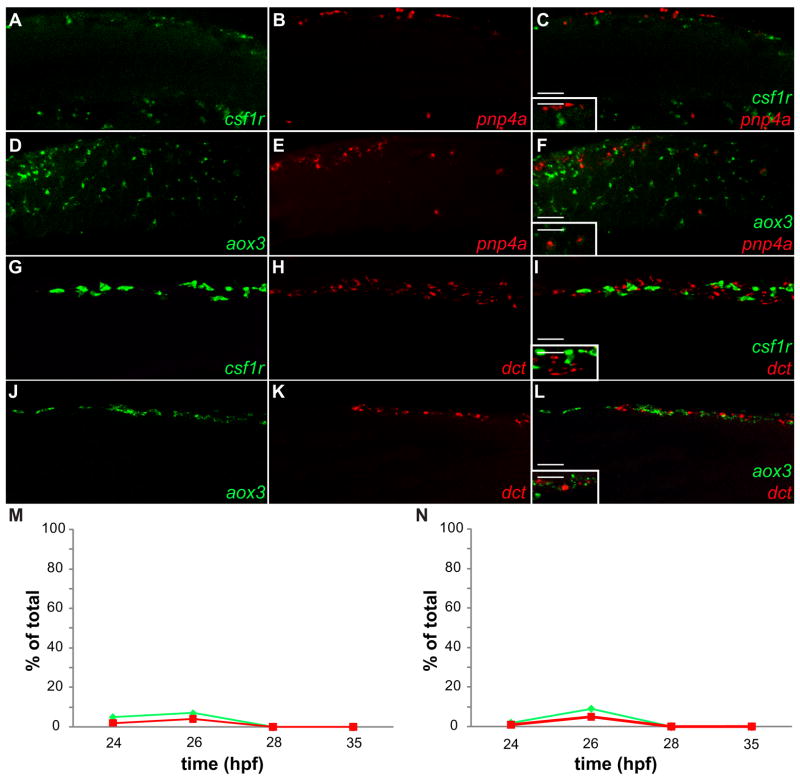
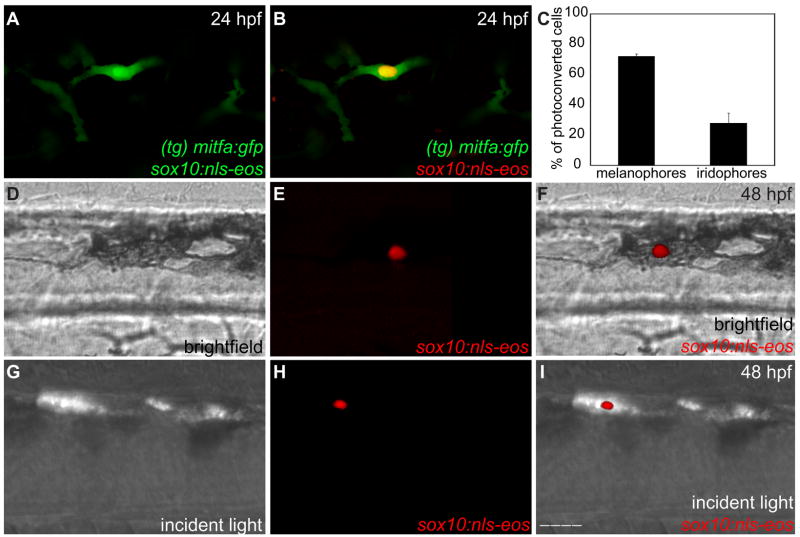
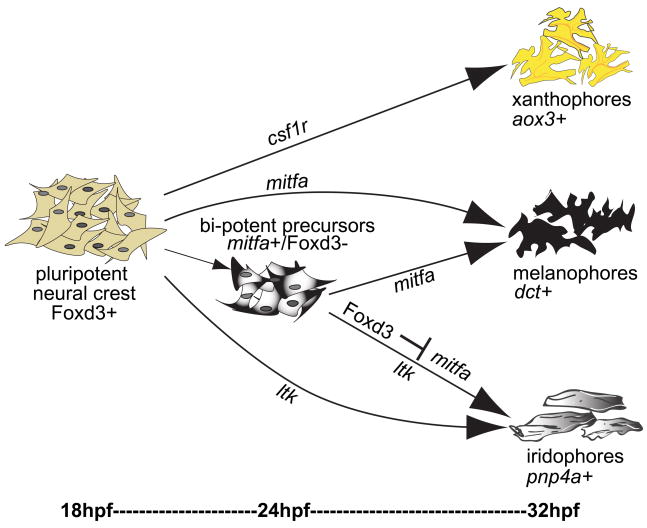
Pigment cells of the zebrafish, Danio rerio, offer an exceptionally tractable system for studying the genetic and cellular bases of cell fate decisions. In the zebrafish, neural crest cells generate three types of pigment cells during embryogenesis: yellow xanthophores, iridescent iridophores and black melanophores. In this study, we present evidence for a model whereby melanophores and iridophores descend from a common precursor whose fate is regulated by an interplay between the transcription factors Mitf and Foxd3. Loss of mitfa, a key regulator of melanophore development, resulted in supernumerary ectopic iridophores while loss of foxd3, a mitfa repressor, resulted in fewer iridophores. Double mutants showed a restoration of iridophores, suggesting that one of Foxd3's roles is to suppress mitfa to promote iridophore development. Foxd3 co-localized with pnp4a, a novel marker of early iridophore development, and was necessary for its expression. A considerable overlap was found between iridoblast and melanoblast markers but not xanthoblast markers, which resolved as cells began to differentiate. Cell lineage analyses using the photoconvertible marker, EosFP, revealed that both melanophores and iridophores develop from a mitfa+ precursor. Taken together, our data reveal a Foxd3/mitfa transcriptional switch that governs whether a bi-potent pigment precursor will attain either an iridophore or a melanophore fate.


Figures

Fig. 1
Fig. 1. Expression pattern of iridophores and pnp4a throughout embryonic development
(A,B) Terminally differentiated iridophores illuminate under incident light. (A) At 42 hpf, three iridophores first reach terminal differentiation along dorsal stripe (arrows), iridophores scatter across the surface of retina (*). (B) By 72 hpf, iridophores more densely populate dorsal, ventral and ventral yolk stripes (arrows). Eye iridophores coalesce into a ring surrounding the lens (*). (C–J,L,M) In situ hybridization reveals pnp4a expression at different embryonic stages. (C) pnp4a first appears in anterior head region at 20hpf, behind primordial eye (arrow). (D) By 22 hpf, pnp4a expresses exclusively in neural crest domains: lateral dorsal stripes along anterior trunk region (white arrow) and cranial region (black arrow). (E) At 24 hpf, pnp4a positive cells migrate posteriorly and ventrally. (F,H,J) Embryos treated with 1× PTU to inhibit melanin synthesis. (F) pnp4a positive cells have organized along the dorsal, ventral and ventral yolk stripes. A patch of pnp4a positive cells scatter across eye and congregate along presumptive swim bladder iridophore patch on dorsal side of yolk ball (*). (H) Close-up of trunk and tail reveal pnp4a positive cells migrate along similar pathway as melanophores in dorsal and ventral stripes, (20X). (I) Close-up of pnp4a positive cells in tail peripheral to v-stripe of melanophores, (20X). (J) pnp4a positive cells coalesce around lens in eye and along yolk ball, (20X). (G,L) pnp4a in situ fluorescence, Red: pnp4a. (K) wild-type embryo illuminated with incident light to reveal iridophore pattern then (L) fixed and processed for pnp4a fluorescent in situ hybridization. (M,N) Dorsal view of head and anterior trunk region of 24 hpf zebrafish. (M) pnp4a expression in wild-type embryo (heterozygous sibling). (N) pnp4a expression in ltk/(shd) mutant. Scale bars: (A,B) 300 μm; (C-G) 150 μm; (H–J) 75 μm; (K,L) 25 μm; (M,N) 80 μm.
Fig. 2
Fig. 2. Foxd3 is necessary for pnp4a expression
(A,B) Wild-type fish co-stained with pnp4a and Foxd3, 24 hpf, anterior trunk. Green: pnp4a mRNA, Red: Foxd3 antibody (A) Punctate, cytoplasmic pnp4a mRNA signal surrounds Foxd3 positive nuclei, 63X. (B) Field reveals a pnp4a+/Foxd3+ cell (arrow) adjacent to three pnp4a−/Foxd3+ cells (*), 40X. (C,D) Flat mounted head and trunk stained with pnp4a riboprobe, 22 hpf, dorsal view, anterior left, 10X. (C) wild-type (D) foxd3 −/− mutant (sym1). Scale bars: (A) 10 μm; (B) 20 μm; (C,D) 70 μm.
Fig. 3
Fig. 3. foxd3/mitfa double mutant exhibits partial rescue of iridophores
(A–D) Incident light reveals iridophores on trunk and tail of 51–54 hpf zebrafish, lateral view, anterior left, 5X. (A) Wild-type zebrafish displays normal numbers of iridophores. (B) mitfa −/− (nacre) displays supernumerary iridophores. (C) foxd3/(sym1) displays iridophore reduction. (D) foxd3/mitfa double mutant exhibits partial rescue of iridophore phenotype as compared to foxd3/− reduction alone. (E) Iridophores were counted along the dorsal and ventral stripes from the posterior tail region, between the cloacae and tail tip. Cell counts taken from 51 zebrafish for each genetic background: Total cell counts (wild-type: 1144), (foxd3/−: 305), (mitfa/−: 1615), (foxd3/mitfa double mutant: 748). Mean iridophore cell counts: (wild-type: 22.9), (foxd3/−: 6.1), (mitfa/−: 32.3), (foxd3/mitfa double mutant: 15.0). Bars = s.d. Scale bar: (A–D) 100 μm.
Fig. 4
Fig. 4. mitfa positive neural crest cells re-acquire Foxd3 expression
(A–C) Confocal images taken from lateral aspect of anterior trunk, 40X. (A) Foxd3, (B) mitfa:gfp, (C) Merge: Red channel: Foxd3. Green channel: mitfa:gfp. (D) Cell counts of mitfa:gfp positive cells that are either Foxd3 positive or negative, counts derived from 40X confocal images at 24 hpf, numbers given as percent of total. 52% of mitfa:gfp+ cells are Foxd3− (432/748). 48% of mitfa:gfp+ cells are Foxd3+ (316/748). Scale bar=30 μm.
Fig. 5
Fig. 5. Iridoblast marker co-localizes with melanoblast markers
(A–O) Confocal images collected from lateral aspect of anterior tail region of fixed zebrafish, 20X. (A–C) Cells co-stained with mitfa riboprobe (red) and pnp4a riboprobe (green) reveal considerable overlap at 24 hpf (A) and diminishing overlap as development proceeds (B,C). mitfa:gfp transgenic reveals mitfa+ cells overlap with pnp4a expression at 24 hpf (D–F) and resolve at 50 hpf (G–I). (D,G) mitfa:gfp (E,H) pnp4a (F,I) Color merge: Green: GFP expression, Red: pnp4a mRNA (inset 40x). Wild-type embryos reveal dct+ cells overlap with pnp4a expression at 24 hpf (J–L) then resolve at 26 hpf (M–O). (J,M) dct (K,N) pnp4a (L,O) Color merge: Green: dct mRNA, Red: pnp4a mRNA (inset-40x). (P,Q) Percent of overlap between chromatoblast markers (see Table 1). (P) Green line= % of mitfa:gfp+ cells that are mitfa:gfp+/pnp4a+. Red line= % of pnp4a+ cells that are mitfa:gfp+/pnp4a+. (Q) Green line= % of dct+ cells that are dct+/pnp4a+. Red line= % of pnp4a+ cells that are dct+/pnp4a+. Scale bars: (A–C) 40 μm; (D–O) 60 μm; (F,I,L,O inset) 30 μm.
Fig. 6
Fig. 6. Neither iridoblast nor melanoblast markers co-localize with xanthoblast markers
(A–L) Confocal images collected from lateral aspect of anterior tail region of fixed zebrafish, 20X. (A–C,M) Wild-type embryo reveals csf1r signal not localized with pnp4a expression at 24 hpf (A) csf1r (B) pnp4a (C) Color merge: Green: csf1r mRNA, Red: pnp4a mRNA (inset 40x). (D–F,N) Wild-type embryo reveals aox3 signal is not localized with pnp4a expression at 24 hpf (D) aox3 (E) pnp4a (F) Color merge: Green: aox3 mRNA, Red: pnp4a mRNA (inset-40x). (G–I) Wild-type embryo reveals csf1r signal is not localized with dct expression at 24 hpf (G) csf1r (H) dct (I) Color merge: Green: csf1r mRNA, Red: dct mRNA (inset 40x). (J–L) Wild-type embryo reveals aox3 signal is not localized with dct expression at 24 hpf (J) aox3 (K) dct (L) Color merge: Green: aox3 mRNA, Red: dct mRNA (inset 40x). (M,N) Percent of overlap between chromatoblast markers (see Table 2,3). (M) Green line= % of csf1r+ cells that are pnp4a+/csf1r+. Red line= % of pnp4a+ cells that are pnp4a+/csf1r+. (N) Green line= % of aox3+ cells that are pnp4a+/aox3+. Red line= % of pnp4a+ cells that are pnp4a+/aox3+. Scale bars: (AL) 60 μm; (C,F,I,L inset) 30 μm.
Fig. 7
Fig. 7. Melanoblasts and iridoblasts share a mitfa+ bipotent precursor
(A,B) Confocal image of a double positive sox10:nls-eos/mitfa:gfp cell surrounded by mitfa:gfp cells, lateral view, anterior trunk, 24 hpf. 40X. (A) Unconverted, pre-UV exposure. (B) Photoconverted, post-UV exposure. (C) Bar graph: 72% of identified photoconverted cells acquire a melanophore fate; 28% of identified photoconverted cells acquire an iridophore fate (n= 144) Bars=s.d. (for all values see Table 4). (D–F) Photoconverted sox10:nls-eos/mitfa:gfp cell acquires melanophore fate, lateral view, anterior trunk, 48 hpf, 40X. (D) Brightfield. (E) Red channel. (F) Merge Brightfield/Red channel. (G–I) Photoconverted sox10:nls-eos/mitfa:gfp cell acquires iridophore fate, lateral view, anterior trunk, 48 hpf, 40X. (G) Incident light. (H) Red channel. (I) Merge Incident/Red channel. Scale bars: (A,B, D–I) 30 μm.
Fig. 8
Fig. 8. Model for chromatophore development from the neural crest
We propose a model for pigment cell lineages that includes two pathways for melanophores and iridophores to differentiate. Pigment cells may develop directly from neural crest cells or transit through a bi-potent pigment precursor stage. Between 18–24 hpf, neural crest cells begin to express lineage-specific markers. Xanthoblasts require csf1r and commit to the pteridine pigment synthesis pathway, as indicated by aox3 expression. Iridoblasts require ltk and continue along the purine synthesis pathway as indicated by pnp4a expression. Melanoblasts require mitfa and continue along the melanin synthesis pathway as indicated by dct expression. In addition, some mitfa+ cells will retain the capacity to produce either melanophores or iridophores, a process regulated by expression of Foxd3. Foxd3 is initially expressed in all neural crest cells at 18 hpf, then downregulated. Foxd3 reappears in approximately half of mitfa+ bi-potent precursors at 24 hpf, resulting in repression of mitfa, activation of pnp4a and promotion to an iridophore fate. A reciprocal population will remain Foxd3 negative, continue mitfa expression and follow the melanophore path.

Similar articles

Cited by

References

    1. Adameyko I, Lallemend F, Aquino JB, Pereira JA, Topilko P, Muller T, Fritz N, Beljajeva A, Mochii M, Liste I, Usoskin D, Suter U, Birchmeier C, Ernfors P. Schwann cell precursors from nerve innervation are a cellular origin of melanocytes in skin. Cell. 2009;139:366–79. - PubMed
    1. Bagnara JT, Fernandez PJ, Fujii R. On the blue coloration of vertebrates. Pigment Cell Res. 2007;20:14–26. - PubMed
    1. Bagnara JT, Matsumoto J, Ferris W, Frost SK, Turner WA, Jr, Tchen TT, Taylor JD. Common origin of pigment cells. Science. 1979;203:410–5. - PubMed
    1. Bagnara JT, Taylor JD, Hadley ME. The dermal chromatophore unit. J Cell Biol. 1968;38:67–79. - PMC - PubMed
    1. Bondurand N, Pingault V, Goerich DE, Lemort N, Sock E, Le Caignec C, Wegner M, Goossens M. Interaction among SOX10, PAX3 and MITF, three genes altered in Waardenburg syndrome. Hum Mol Genet. 2000;9:1907–17. - PubMed

Substances