

Independent filtering increases detection power for high-throughput experiments
- PMID: 20460310
- PMCID: PMC2906865
- DOI: 10.1073/pnas.0914005107
Independent filtering increases detection power for high-throughput experiments
Abstract
With high-dimensional data, variable-by-variable statistical testing is often used to select variables whose behavior differs across conditions. Such an approach requires adjustment for multiple testing, which can result in low statistical power. A two-stage approach that first filters variables by a criterion independent of the test statistic, and then only tests variables which pass the filter, can provide higher power. We show that use of some filter/test statistics pairs presented in the literature may, however, lead to loss of type I error control. We describe other pairs which avoid this problem. In an application to microarray data, we found that gene-by-gene filtering by overall variance followed by a t-test increased the number of discoveries by 50%. We also show that this particular statistic pair induces a lower bound on fold-change among the set of discoveries. Independent filtering-using filter/test pairs that are independent under the null hypothesis but correlated under the alternative-is a general approach that can substantially increase the efficiency of experiments.
Conflict of interest statement
The authors declare no conflict of interest.
Figures
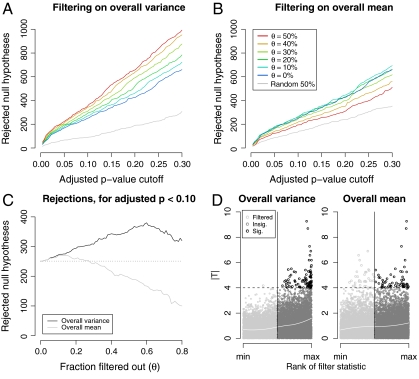
 ), on the other hand, produced a small increase in rejections at low stringency, but then substantially reduced rejections, and thus power, at higher stringencies. (C) Effect of increasing filtering stringency for fixed adjusted p-value cutoff α = 0.1. At higher stringencies, both filters eventually reduced rejections. For the ALL data, this effect occurred much more quickly for the overall mean filter. With the overall variance filter, the number of rejections increased by up to 50%. (D) Filtering on overall mean (θ = 0.5 is shown) removed many significant |Ti| (e.g., |Ti| > 4), while filtering on overall variance retained them.
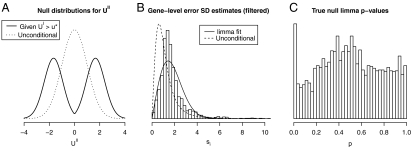
 ). (B) Filtering on overall variance (θ = 0.5) preferentially eliminated genes with small si, causing gene-level standard deviation estimates for genes passing the filter (histogram) to be shifted relative to the unconditional distribution used to generate the data (dashed curve). The limma inverse χ2 model was unable to provide a good fit (solid curve) to the si passing the filter. (C) The fitting problems lead to a posterior degrees-of-freedom estimate of ∞. As a consequence, p-values were computed using an inappropriate null distribution, producing too many true-null p-values close to zero, i.e., loss of type I error rate control. An analogous analysis comparing biological replicates from the ALL study—so that real array data were used but no gene was expected to exhibit significant differential expression—yielded qualitatively similar results.
Comment in
-
Filtering data from high-throughput experiments based on measurement reliability.Proc Natl Acad Sci U S A. 2010 Nov 16;107(46):E173-4; author reply E175. doi: 10.1073/pnas.1010604107. Epub 2010 Nov 8. Proc Natl Acad Sci U S A. 2010. PMID: 21059952 Free PMC article. No abstract available.
References
-
- Kerr MK, Martin M, Churchill GA. Analysis of variance for gene expression microarray data. J Comput Biol. 2000;7:819–837. - PubMed
-
- Lönnstedt I, Speed TP. Replicated microarray data. Stat Sinica. 2002;12:31–46.
-
- Smyth GK. Linear models and empirical Bayes methods for assessing differential expression in microarray experiments. Stat Appl Genet Mol Biol. 2004;3:Article 3. - PubMed
-
- Robinson MD, Smyth GK. Moderated statistical tests for assessing differences in tag abundance. Bioinformatics. 2007;23:2881–2887. - PubMed
Publication types
MeSH terms
LinkOut - more resources
Full Text Sources
Other Literature Sources
Molecular Biology Databases
