. 2010 Jun;137(11):1907-17.
doi: 10.1242/dev.040410.

Cdk5rap2 regulates centrosome function and chromosome segregation in neuronal progenitors

Affiliations

Cdk5rap2 regulates centrosome function and chromosome segregation in neuronal progenitors

Sofia B Lizarraga et al. Development. 2010 Jun.

Abstract

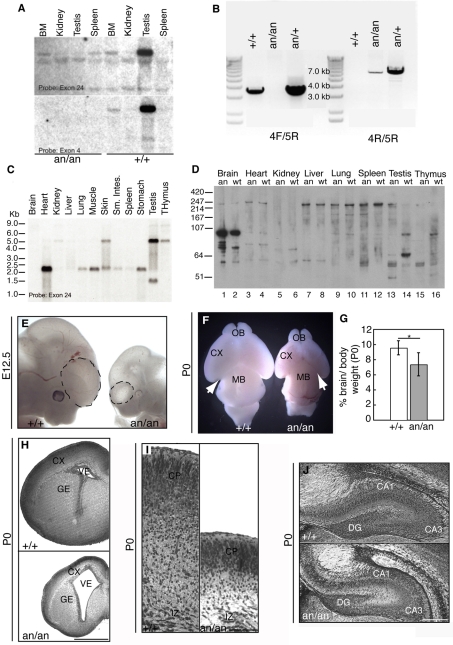
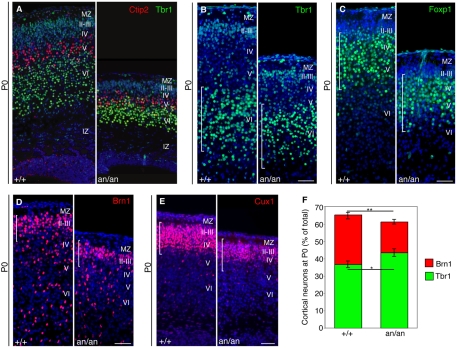
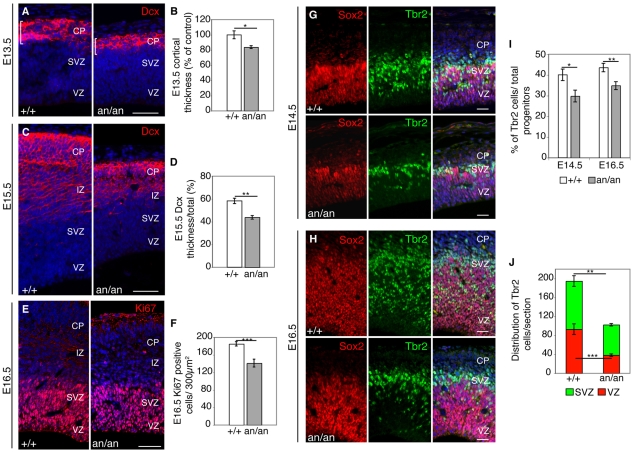
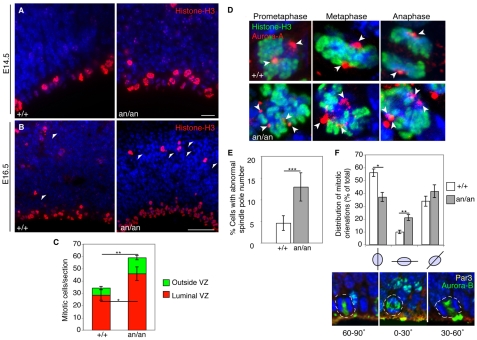
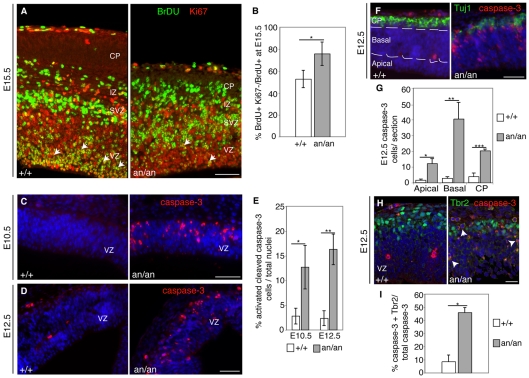
Microcephaly affects approximately 1% of the population and is associated with mental retardation, motor defects and, in some cases, seizures. We analyzed the mechanisms underlying brain size determination in a mouse model of human microcephaly. The Hertwig's anemia (an) mutant shows peripheral blood cytopenias, spontaneous aneuploidy and a predisposition to hematopoietic tumors. We found that the an mutation is a genomic inversion of exon 4 of Cdk5rap2, resulting in an in-frame deletion of exon 4 from the mRNA. The finding that CDK5RAP2 human mutations cause microcephaly prompted further analysis of Cdk5rap2(an/an) mice and we demonstrated that these mice exhibit microcephaly comparable to that of the human disease, resulting from striking neurogenic defects that include proliferative and survival defects in neuronal progenitors. Cdk5rap2(an/an) neuronal precursors exit the cell cycle prematurely and many undergo apoptosis. These defects are associated with impaired mitotic progression coupled with abnormal mitotic spindle pole number and mitotic orientation. Our findings suggest that the reduction in brain size observed in humans with mutations in CDK5RAP2 is associated with impaired centrosomal function and with changes in mitotic spindle orientation during progenitor proliferation.


Figures

Fig. 1.
Fig. 1.
Hertwig's anemia (an) is due to an inversion of exon 4 of Cdk5rap2, resulting in exon 4 skipping and abnormal cortical development. (A) Exon 4 is skipped in an/an homozygotes. Cdk5rap2 expression is detected in both +/+ and an/an mice using an exon 24 probe (upper panel). However, reprobing the same blot with an exon 4 probe yields no signal in an/an animals (lower panel). (B) PCR of genomic DNA from +/+, an/+ and an/an WBB6F1 confirmed the presence of an inversion surrounding exon 4. (C) Northern blot of adult mouse tissues demonstrating a 2.3 kb transcript expressed in most tissues, a 5.8 kb transcript expressed in several tissues and particularly strongly in testis, and a 1.4 kb transcript expressed only in testis. (D) Western analysis of Cdk5rap2 protein in +/+ and an/an adults. Most tissues have a large (∼230 kDa) isoform, whereas the testis, thymus and brain also contain a smaller (∼105 kDa) isoform. A testis-specific protein isoform (∼70 kDa) is also observed. (E) B6.Cg an/an embryos have reduced brain and body sizes already at E12.5, as compared with controls. Dashed lines highlight cortical vesicles. (F) Transmitted light micrograph of P0 B6.Cg Cdk5rap2+/+ and Cdk5rap2an/an brains. Mutant brains are smaller with a disproportionately reduced cortex (CX) and smaller olfactory bulbs (OB). Arrows indicate that more of the midbrain (MB) area is exposed in Cdk5rap2an/an than in the control. (G) Analysis of the brain-to-body weight ratio in the B6.Cg background, showing that the mean brain-to-body weight ratio at P0 is decreased in Cdk5rap2an/an animals. Error bars indicate s.d. *, P=7×10⁻⁵. (H) Histological analysis of P0 brains from B6.Cg animals. Coronal sections (5 μm) stained with Cresyl Violet show a thinner cortex, reduced ganglionic eminence (GE) and enlarged ventricle (VE) in the mutants. (I) At P0, the cortex of Cdk5rap2an/an animals is smaller but shows a laminar organization that is similar to that of control littermates. A high-magnification micrograph shows the cortical plate (CP) and intermediate zone (IZ) in control (left) and mutant (right) animals. (J) At P0, the hippocampus is smaller in Cdk5rap2an/an (bottom) than in controls (top). DG, dentate gyrus; CA1 and CA3, cornus ammonis 1 and 3. Scale bars: 200 μm in H; 100 μm in I,J.
Fig. 2.
Fig. 2.
Cdk5rap2an/an mice show reduced neuronal number and thinner superficial layers but preserved cortical layer organization. (A) Cdk5Rap2 mutant mice show preserved cortical layer organization, although each layer is far thinner than normal. P0 wild-type (+/+) and mutant (an/an) littermates are shown. Coronal sections stained with Tbr1 antisera, which labels deep layer VI neurons (green), and with Ctip2 antisera, which labels layer V neurons (red), show the preservation of cortical layer organization in the mutant. The marginal zone (MZ) and IZ are also shown. (B,C) Deeper cortical layer markers show the overall reduction in cortical thickness in the an/an mutant. (B) Tbr1, layer VI; (C) Foxp1, layers III-V. (D,E) Superficial cortical layers are reduced in the Cdk5Rap2an/an brain. P0 wild-type (+/+) and mutant (an/an) littermate coronal sections stained with antisera against (D) Brn1 (layers II-III) and (E) Cux1 (layers II-IV). In B-E the brackets correspond to wild type and highlight the differences between mutant and control animals. (F) The density of superficial and deeper neuronal layers. The density of layers II-III was calculated as the ratio of Brn1-positive cells to total CP nuclei counted per section (the mean percentage is shown). The Brn1 density (red bars) in wild-type (n=6 animals, 486 cells counted/section) and mutant (n=7 animals, 417 cells counted/section) animals is significantly different; **, P=7.4×10⁻¹⁰. The corresponding increase in the density of deep neuronal layer VI is shown. The percentage of Tbr1-positive cells (green bars) among total CP nuclei is moderately increased in the mutant (n=5 animals, 431 cells counted/section) as compared with control littermates (n=6 animals, 544 cells counted/section); *, P=1.3×10⁻⁴. Sections were counterstained with Hoechst 33342 (blue) to label nuclei. Error bars indicate s.e.m. Scale bars: 50 μm.
Fig. 3.
Fig. 3.
Neurons and neuronal progenitors are reduced in Cdk5rap2an/an mice. (A) E13.5 coronal sections immunostained for Dcx (a marker for immature neurons) in wild-type (+/+) and mutant (an/an) littermate pairs. (B) Overall cortical thickness is reduced at E13.5 in Cdk5rap2an/an animals (n=5) compared with controls (n=3). The mean is shown as a percentage of the control mean (+/+, 100±5.2%; an/an, 83.9±1.8%); *, P=0.001. (C) E15.5 coronal sections show a significantly reduced CP in mutants. (D) CP thickness at E15.5 in mutants and controls (n=4) shown as the ratio of Dcx-positive cortical thickness over total cortical thickness. **, P=6.3×10⁻⁴. (E) Total proliferating cells are reduced in the mutants (n=7) compared with controls (n=4). Coronal sections of E16.5 littermates were analyzed by Ki67 immunostaining. (F) Quantitation of proliferating cells, showing the total number of Ki67-positive cells counted per 300 μm2. ***, P=0.002. (G,H) Coronal sections of E14.5 and E16.5 littermates were analyzed using Tbr2 (green), a marker for basal progenitors, and Sox2 (red), a marker for neuronal progenitors. (G) E14.5 embryos show some Tbr2-labeled cells in the VZ, SVZ and CP. (H) At E16.5, the reduction in Tbr2-positive cells is also evident across the VZ and SVZ in Cdk5rap2an/an embryos. (I) At E14.5, Cdk5rap2an/an embryos (n=5, 214 cells counted/section) had 11.9% fewer Tbr2-positive cells than Cdk5rap2+/+ (n=5, 366 cells counted/section); *, P=2×10⁻⁴. At E16.5, Cdk5rap2an/an embryos (n=5, 420 cells counted/section) had 9.3% fewer Tbr2-positive cells than Cdk5rap2+/+ (n=5, 630 cells counted/section); **, P=1.3×10⁻⁶. (J) The distribution of Tbr2-positive cells changes in the Cdk5rap2an/an animals. The mean number of Tbr2-positive cells is shown for the VZ and the SVZ. Control embryos had 2.4-fold more Tbr2-positive cells in the VZ and 1.5-fold more in the SVZ than the mutants. **, P=0.01; ***, P=0.003. Error bars indicate s.e.m. (B,D,F,I) or s.d. (J). Scale bars: 50 μm in A,C,E; 200 μm in G,H.
Fig. 4.
Fig. 4.
Cdk5rap2an/an neuronal progenitors exhibit mitotic defects and changes in mitotic spindle orientation. (A,B) Cdk5rap2 mutants have increased numbers of phospho-histone H3-labeled cells. Fluorescent micrographs of Cdk5rap2+/+ and Cdk5rap2an/an coronal sections at (A) E14.5 and (B) E16.5. Phospho-histone H3 (red) immunostaining shows cells in M phase lining the VZ, and away from the VZ (arrowheads). Nuclei are stained with Hoechst (blue). (C) Analysis of mitotic index in E16.5 embryos. M-phase cells counted along the luminal VZ from the medial-dorsal to the dorsal-lateral junction. Dorsal mitotic cells away from the VZ were also measured. The mean total mitotic cells per coronal section and their localization at the luminal VZ, or away from the VZ, are shown. At E16.5, Cdk5rap2an/an mice (n=5, average of 330 mitotic cells counted/animal) had 1.8-fold more M-phase cells than controls (n=5, average of 128 mitotic cells counted/animal); P=1.12×10⁻⁸. M-phase cells increased at the luminal VZ (*, P=5.64×10⁻⁶) and outside of the VZ (**, P=2.22×10⁻⁸). (D) Cdk5rap2an/an animals have abnormal numbers of spindle poles. Aurora kinase A labels spindle poles (red), whereas phospho-histone H3 labels M-phase cells (green). Arrowheads indicate aurora kinase A-labeled spindle poles. Representative confocal images of Cdk5rap2+/+ precursor cells (top) in prometaphase (left), metaphase (center) and anaphase (right) with bipolar spindles, and Cdk5rap2an/an precursor cells (bottom) in prometaphase with a tetrapolar spindle (left), in metaphase with a tripolar spindle (center), and in anaphase with a tetrapolar spindle (right). (E) Cdk5rap2an/an animals show a 2.8-fold increase in the percentage of abnormal mitotic figures per total number of M-phase cells at the luminal VZ. ***, P=3.26×10⁻⁶. (F) Analysis of spindle orientation at E16.5. Bar chart shows the distribution of horizontal (0-30°), oblique (30-60°) and vertical (60-90°) cleavage planes. Cdk5rap2an/an embryos have increased horizontal and decreased vertical cleavage planes (n=4, average of 88 cells counted/animal; **, P=0.005), compared with Cdk5rap2+/+ embryos (n=4, average of 89 cells counted/animal; *, P=0.006). Beneath are shown representative three-dimensional reconstructed confocal images of horizontal, oblique and vertical cleavage planes. Nuclei are stained with Hoechst (blue), the central spindle and midbody are stained for aurora kinase B (green), and the apical membrane is stained for Par3 (yellow). Error bars indicate s.d. Scale bars: 10 μm in A; 50 μm in B.
Fig. 5.
Fig. 5.
Cdk5Rap2an/an embryos exhibit increased cell death and premature cell cycle exit. (A) Increased cell cycle exit in Cdk5Rap2an/an mice. An E14.5 pregnant female was injected with BrdU and sacrificed after 24 hours. BrdU-labeled progenitors (green) that remain in the cell cycle at E15.5 were identified by co-immunostaining for Ki67 (red). E15.5 Cdk5Rap2+/+ (n=5) and Cdk5Rap2an/an (n=6) embryos were analyzed to determine the fraction of cells leaving the cell cycle by counting BrdU-positive Ki67-negative cells as compared with the total number of BrdU-positive cells. More cells labeled exclusively with BrdU are seen in the IZ and CP of Cdk5Rap2an/an. Greater numbers of cycling cells labeled with both BrdU and Ki67 are found in the VZ of Cdk5Rap2+/+ (arrows). However, Cdk5Rap2an/an had fewer cells that remained in the cell cycle (arrows). (B) Analysis of the `exit fraction' in E15.5 littermates. The mean percentage of BrdU-positive Ki67-negative among total cells is shown for Cdk5Rap2+/+ (336 cells counted/animal) and Cdk5Rap2an/an (420 cells counted/animal). *, P=4.2×10⁻⁵. (C,D) Cdk5Rap2an/an animals show increased apoptosis. Coronal sections of (C) E10.5 and (D) E12.5 control and mutant embryos labeled with caspase 3 antibodies (red) and stained with Hoechst (blue) for nuclei. (E) The mean percentage of caspase 3-labeled cells in E10.5 and E12.5 embryos. Analysis of E10.5 littermates showed that Cdk5Rap2an/an embryos (n=3 animals, 293 cells counted/section) had a 4.5-fold increase in the percentage of apoptotic cells as compared with controls (n=3 animals, 354 cells counted/section); *, P=1.7×10⁻⁶. Cdk5Rap2an/an E12.5 embryos (n=4 animals, 419 cells counted/section) had 6.8-fold more cell death than controls (n=4 animals, 503 cells counted/section); **, P=1.7×10⁻¹³. (F) Cdk5Rap2an/an E12.5 embryos show a higher index of apoptotic neuronal precursor and neuronal cells. Caspase 3-positive cells (red) are present in the apical, basal and CP regions. CP is shown by Tuj1 (green) immunostaining. (G) The average number of caspase 3-labeled cells in each region in E12.5 embryos. Cdk5Rap2an/an embryos (n=3 animals, 73 dying cells counted/section) had 7.7-fold more dying cells in the apical region (*, P=5.8×10⁻⁶), 14.4-fold more apoptosis in the basal region (**, P=2.9×10⁻⁶), and 5.3-fold more cell death in the CP (***, P=5.7×10⁻⁶) than controls (n=3 animals, 8.2 dying cells counted/section). (H) Cdk5Rap2an/an E12.5 embryos have a higher percentage of Tbr2 (green) and caspase 3 (red) double-positive cells (arrows) than controls. (I) The percentage of Tbr2 and caspase 3 double-labeled cells among the total caspase 3-positive cells in Cdk5Rap2an/an (n=3 animals, 370 cells counted/section) and in controls (n=4 animals, 466 cells counted/section); *, P=2.6×10⁻¹⁰. Error bars indicate s.d. (B,E) or s.e.m. (G,I). Scale bars: 50 μm in A; 25 μm in C,D,F; 20 μm in H.

References

    1. Angevine J. B., Jr, Sidman R. L. (1961). Autoradiographic study of cell migration during histogenesis of cerebral cortex in the mouse. Nature 192, 766-768 - PubMed
    1. Baelde H. J., Cleton-Jansen A. M., van Beerendonk H., Namba M., Bovee J. V., Hogendoorn P. C. (2001). High quality RNA isolation from tumours with low cellularity and high extracellular matrix component for cDNA microarrays: application to chondrosarcoma. J. Clin. Pathol. 54, 778-782 - PMC - PubMed
    1. Bani-Yaghoub M., Tremblay R. G., Lei J. X., Zhang D., Zurakowski B., Sandhu J. K., Smith B., Ribecco-Lutkiewicz M., Kennedy J., Walker P. R., et al. (2006). Role of Sox2 in the development of the mouse neocortex. Dev. Biol. 295, 52-66 - PubMed
    1. Barker J. E., Bernstein S. E. (1983). Hertwig's anemia: characterization of the stem cell defect. Blood 61, 765-769 - PubMed
    1. Barker J. E., Deveau S. A., Compton S. T., Fancher K., Eppig J. T. (2005). High incidence, early onset of histiocytic sarcomas in mice with Hertwig's anemia. Exp. Hematol. 33, 1118-1129 - PubMed

Publication types

MeSH terms