

Tyrosine kinase inhibitor gefitinib enhances topotecan penetration of gliomas
- PMID: 20460504
- PMCID: PMC2880208
- DOI: 10.1158/0008-5472.CAN-09-4264
Tyrosine kinase inhibitor gefitinib enhances topotecan penetration of gliomas
Abstract
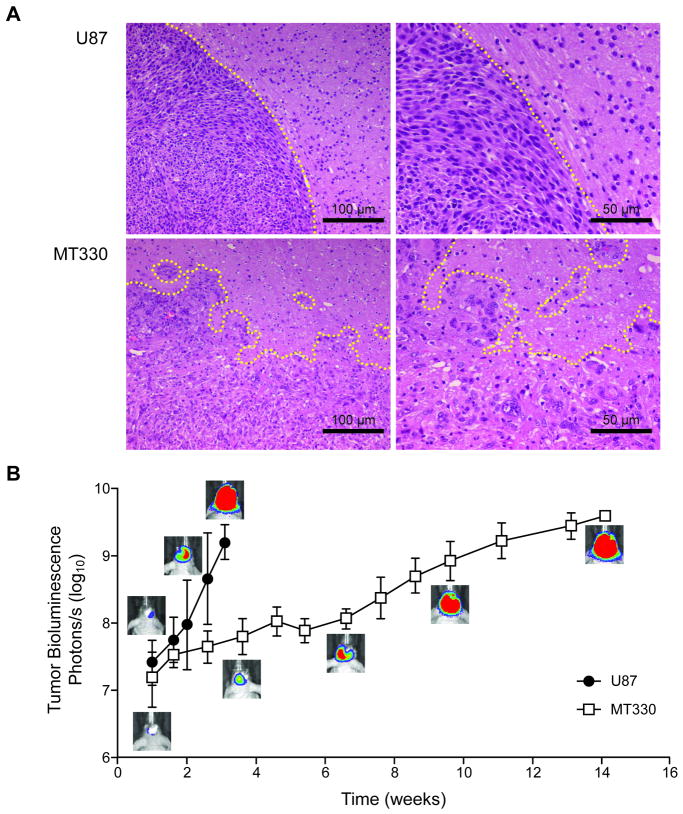
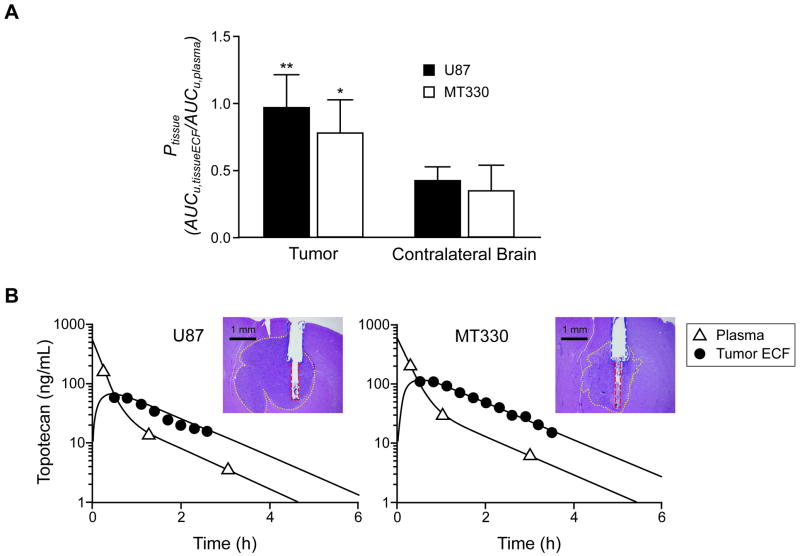
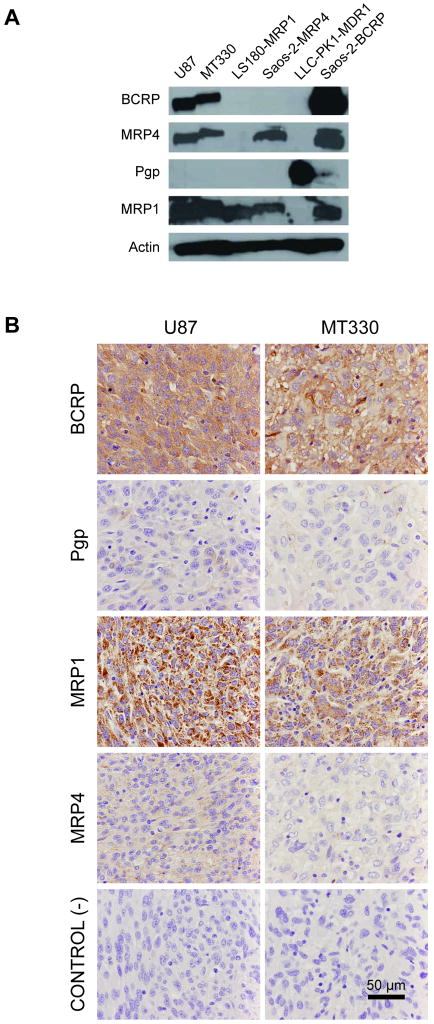
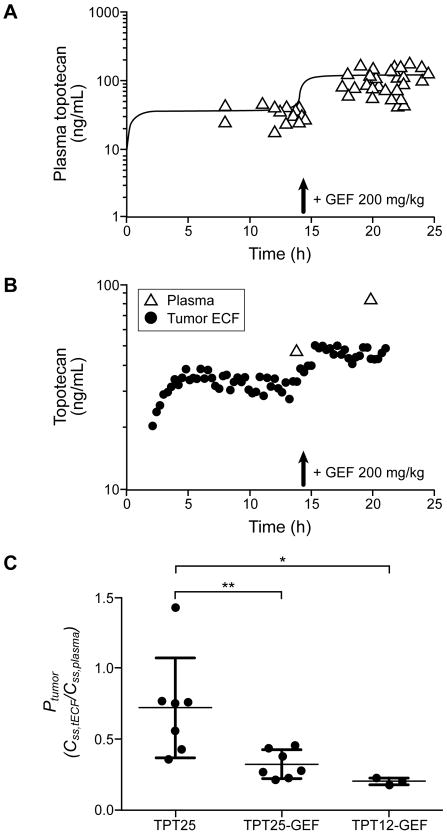
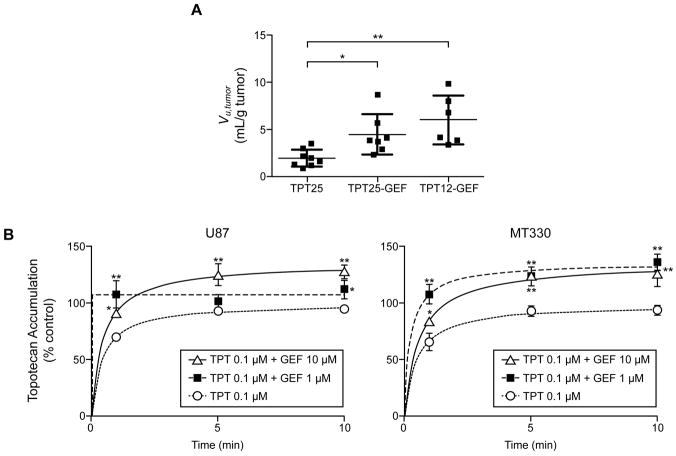
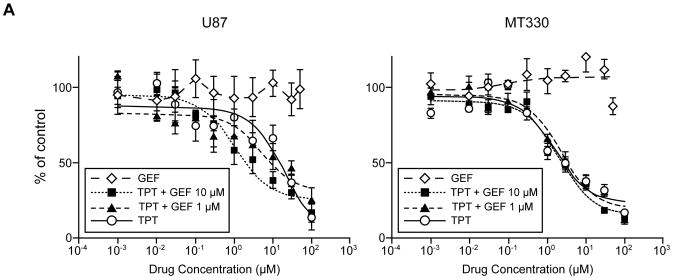
Gefitinib, an epidermal growth factor receptor tyrosine kinase inhibitor, increases brain parenchymal extracellular fluid (ECF) accumulation of topotecan, a substrate of the ATP-binding cassette (ABC) transporters P-glycoprotein (Pgp/MDR-1) and breast cancer resistance protein (BCRP/ABCG2). The effect of modulating these transporters on topotecan penetration in gliomas has not been thoroughly studied. Thus, we performed intracerebral microdialysis on mice bearing orthotopic human gliomas (U87 and MT330) and assessed topotecan tumor ECF (tECF) penetration and the effect of gefitinib on topotecan tECF penetration and intratumor topotecan distribution. We found that topotecan penetration (P(tumor)) of U87 was 0.96 +/- 0.25 (n = 7) compared with that of contralateral brain (P(contralateral), 0.42 +/- 0.11, n = 5; P = 0.001). In MT330 tumors, P(tumor) (0.78 +/- 0.26, n = 6) and P(contralateral) (0.42 +/- 0.11, n = 5) also differed significantly (P = 0.013). Because both tumor models had disrupted blood-brain barriers and similar P(tumor) values, we used U87 and a steady-state drug administration approach to characterize the effect of gefitinib on topotecan P(tumor). At equivalent plasma topotecan exposures, we found that P(tumor) after gefitinib administration was lower. In a separate cohort of animals, we determined the volume of distribution of unbound topotecan in tumor (V(u,tumor)) and found that it was significantly higher in groups receiving gefitinib, implying that gefitinib administration leads to a greater proportion of intracellular topotecan. Our results provide crucial insights into the role that transporters play in central nervous system drug penetration and provide a better understanding of the effect of coadministration of transporter modulators on anticancer drug distribution within a tumor.
Copyright 2010 AACR.
Figures
Similar articles
-
Topotecan central nervous system penetration is altered by a tyrosine kinase inhibitor.Cancer Res. 2006 Dec 1;66(23):11305-13. doi: 10.1158/0008-5472.CAN-06-0929. Cancer Res. 2006. PMID: 17145877
-
Compartment-specific roles of ATP-binding cassette transporters define differential topotecan distribution in brain parenchyma and cerebrospinal fluid.Cancer Res. 2009 Jul 15;69(14):5885-92. doi: 10.1158/0008-5472.CAN-09-0700. Epub 2009 Jun 30. Cancer Res. 2009. PMID: 19567673 Free PMC article.
-
Gefitinib ("Iressa", ZD1839), an epidermal growth factor receptor tyrosine kinase inhibitor, reverses breast cancer resistance protein/ABCG2-mediated drug resistance.Cancer Res. 2005 Feb 15;65(4):1541-6. doi: 10.1158/0008-5472.CAN-03-2417. Cancer Res. 2005. PMID: 15735043
-
Obstacles to Brain Tumor Therapy: Key ABC Transporters.Int J Mol Sci. 2017 Nov 27;18(12):2544. doi: 10.3390/ijms18122544. Int J Mol Sci. 2017. PMID: 29186899 Free PMC article. Review.
-
Role of ABC transporters in the chemoresistance of human gliomas.Curr Cancer Drug Targets. 2006 Aug;6(5):433-45. doi: 10.2174/156800906777723930. Curr Cancer Drug Targets. 2006. PMID: 16918310 Review.
Cited by
-
Preclinical examination of clofarabine in pediatric ependymoma: intratumoral concentrations insufficient to warrant further study.Cancer Chemother Pharmacol. 2015 May;75(5):897-906. doi: 10.1007/s00280-015-2713-z. Epub 2015 Feb 28. Cancer Chemother Pharmacol. 2015. PMID: 25724157 Free PMC article.
-
Phase I dosage finding and pharmacokinetic study of intravenous topotecan and oral erlotinib in adults with refractory solid tumors.Cancer Chemother Pharmacol. 2014 Mar;73(3):561-8. doi: 10.1007/s00280-014-2385-0. Epub 2014 Jan 22. Cancer Chemother Pharmacol. 2014. PMID: 24448640 Free PMC article. Clinical Trial.
-
Role of ATP-binding cassette and solute carrier transporters in erlotinib CNS penetration and intracellular accumulation.Clin Cancer Res. 2011 Jan 1;17(1):89-99. doi: 10.1158/1078-0432.CCR-10-1934. Epub 2010 Nov 18. Clin Cancer Res. 2011. PMID: 21088257 Free PMC article.
-
Observational Evaluations of Mice during Cerebral Microdialysis for Pediatric Brain Tumor Research.J Am Assoc Lab Anim Sci. 2015 May;54(3):304-10. J Am Assoc Lab Anim Sci. 2015. PMID: 26045457 Free PMC article.
-
Active efflux of Dasatinib from the brain limits efficacy against murine glioblastoma: broad implications for the clinical use of molecularly targeted agents.Mol Cancer Ther. 2012 Oct;11(10):2183-92. doi: 10.1158/1535-7163.MCT-12-0552. Epub 2012 Aug 13. Mol Cancer Ther. 2012. PMID: 22891038 Free PMC article.
References
-
- Wen PY, Kesari S. Malignant gliomas in adults. N Engl J Med. 2008;359:492–507. - PubMed
-
- Tredan O, Galmarini CM, Patel K, Tannock IF. Drug resistance and the solid tumor microenvironment. J Natl Cancer Inst. 2007;99:1441–54. - PubMed
-
- Loscher W, Potschka H. Drug resistance in brain diseases and the role of drug efflux transporters. Nat Rev Neurosci. 2005;6:591–602. - PubMed
-
- Gottesman MM, Fojo T, Bates SE. Multidrug resistance in cancer: role of ATP-dependent transporters. Nat Rev Cancer. 2002;2:48–58. - PubMed
-
- Maliepaard M, van Gastelen MA, de Jong LA, Pluim D, van Waardenburg RC, Ruevekamp-Helmers MC, et al. Overexpression of the BCRP/MXR/ABCP gene in a topotecan-selected ovarian tumor cell line. Cancer Res. 1999;59:4559–63. - PubMed
Publication types
MeSH terms
Substances
Grants and funding
LinkOut - more resources
Full Text Sources
Other Literature Sources
Medical
Research Materials
Miscellaneous
