

Genome-wide analysis of genetic loci associated with Alzheimer disease
- PMID: 20460622
- PMCID: PMC2989531
- DOI: 10.1001/jama.2010.574
Genome-wide analysis of genetic loci associated with Alzheimer disease
Abstract
Context: Genome-wide association studies (GWAS) have recently identified CLU, PICALM, and CR1 as novel genes for late-onset Alzheimer disease (AD).
Objectives: To identify and strengthen additional loci associated with AD and confirm these in an independent sample and to examine the contribution of recently identified genes to AD risk prediction in a 3-stage analysis of new and previously published GWAS on more than 35,000 persons (8371 AD cases).
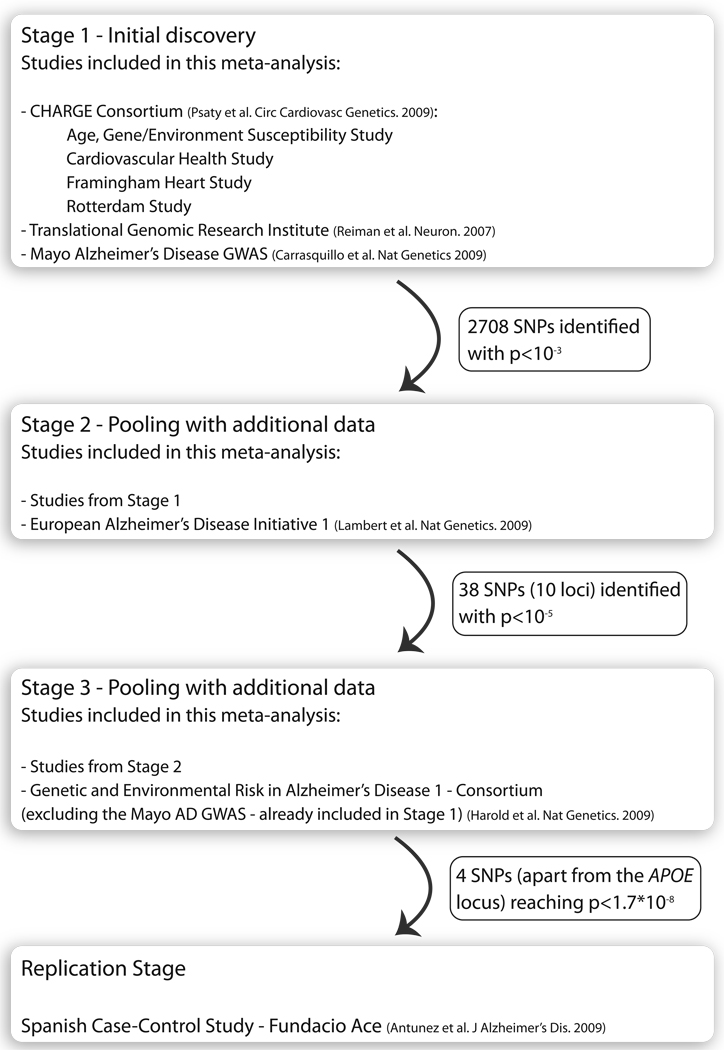
Design, setting, and participants: In stage 1, we identified strong genetic associations (P < 10(-3)) in a sample of 3006 AD cases and 14,642 controls by combining new data from the population-based Cohorts for Heart and Aging Research in Genomic Epidemiology consortium (1367 AD cases [973 incident]) with previously reported results from the Translational Genomics Research Institute and the Mayo AD GWAS. We identified 2708 single-nucleotide polymorphisms (SNPs) with P < 10(-3). In stage 2, we pooled results for these SNPs with the European AD Initiative (2032 cases and 5328 controls) to identify 38 SNPs (10 loci) with P < 10(-5). In stage 3, we combined data for these 10 loci with data from the Genetic and Environmental Risk in AD consortium (3333 cases and 6995 controls) to identify 4 SNPs with P < 1.7x10(-8). These 4 SNPs were replicated in an independent Spanish sample (1140 AD cases and 1209 controls). Genome-wide association analyses were completed in 2007-2008 and the meta-analyses and replication in 2009.
Main outcome measure: Presence of Alzheimer disease.
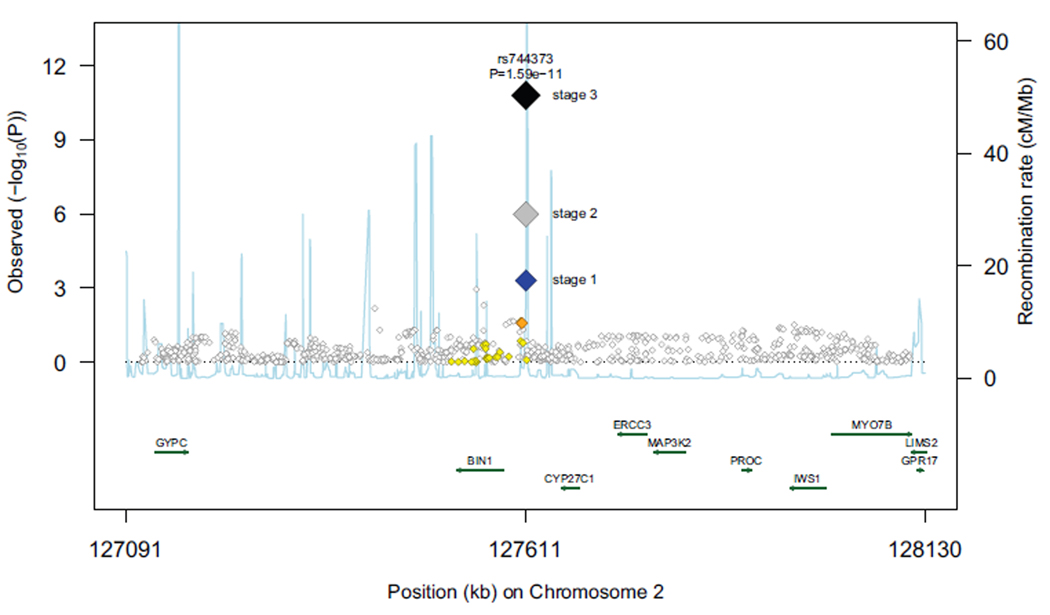
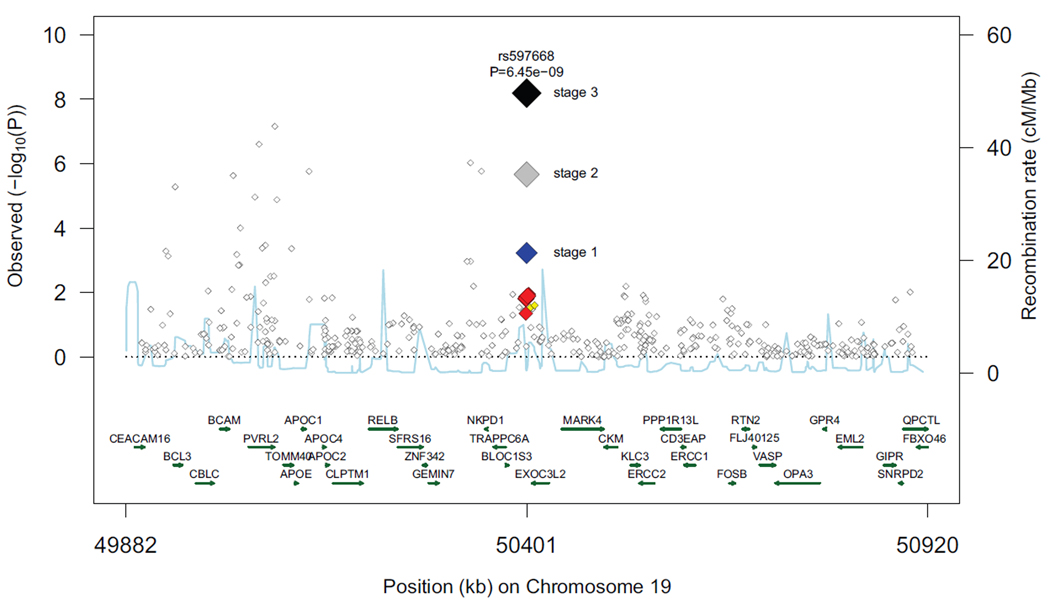
Results: Two loci were identified to have genome-wide significance for the first time: rs744373 near BIN1 (odds ratio [OR],1.13; 95% confidence interval [CI],1.06-1.21 per copy of the minor allele; P = 1.59x10(-11)) and rs597668 near EXOC3L2/BLOC1S3/MARK4 (OR, 1.18; 95% CI, 1.07-1.29; P = 6.45x10(-9)). Associations of these 2 loci plus the previously identified loci CLU and PICALM with AD were confirmed in the Spanish sample (P < .05). However, although CLU and PICALM were confirmed to be associated with AD in this independent sample, they did not improve the ability of a model that included age, sex, and APOE to predict incident AD (improvement in area under the receiver operating characteristic curve from 0.847 to 0.849 in the Rotterdam Study and 0.702 to 0.705 in the Cardiovascular Health Study).
Conclusions: Two genetic loci for AD were found for the first time to reach genome-wide statistical significance. These findings were replicated in an independent population. Two recently reported associations were also confirmed. These loci did not improve AD risk prediction. While not clinically useful, they may implicate biological pathways useful for future research.
Figures
Comment in
-
Reaching the limits of genome-wide significance in Alzheimer disease: back to the environment.JAMA. 2010 May 12;303(18):1864-5. doi: 10.1001/jama.2010.609. JAMA. 2010. PMID: 20460629 No abstract available.
-
Genome-wide association study of genetic loci and Alzheimer disease.JAMA. 2010 Aug 25;304(8):858; author reply 858. doi: 10.1001/jama.2010.1172. JAMA. 2010. PMID: 20736468 No abstract available.
-
Sample tracking and use in published genome-wide association studies.Arch Neurol. 2010 Oct;67(10):1267-8. doi: 10.1001/archneurol.2010.251. Arch Neurol. 2010. PMID: 20937956 No abstract available.
References
-
- Seshadri S, Wolf PA. Lifetime risk of stroke and dementia: current concepts, and estimates from the Framingham Study. Lancet Neurol. 2007;6(12):1106–1114. - PubMed
-
- Gatz M, Reynolds CA, Fratiglioni L, et al. Role of genes and environments for explaining Alzheimer disease. Arch Gen Psychiatry. 2006;63(2):168–174. - PubMed
Publication types
MeSH terms
Grants and funding
- N01-HC-85081/HC/NHLBI NIH HHS/United States
- N01 HC025195/HC/NHLBI NIH HHS/United States
- P01 AG03991/AG/NIA NIH HHS/United States
- AG08122/AG/NIA NIH HHS/United States
- AG031287/AG/NIA NIH HHS/United States
- P50 AG16574/AG/NIA NIH HHS/United States
- N02-HL-6-4278/HL/NHLBI NIH HHS/United States
- N01-HC-25195/HC/NHLBI NIH HHS/United States
- N01 HC085086/HC/NHLBI NIH HHS/United States
- P50 AG05681/AG/NIA NIH HHS/United States
- R01 NS017950/NS/NINDS NIH HHS/United States
- AG15928/AG/NIA NIH HHS/United States
- WT_/Wellcome Trust/United Kingdom
- N01 AG012100/AG/NIA NIH HHS/United States
- R01 AG016495/AG/NIA NIH HHS/United States
- N01 HC085081/HC/NHLBI NIH HHS/United States
- R01 AG015928/AG/NIA NIH HHS/United States
- U24 AG021886/AG/NIA NIH HHS/United States
- U01 HL080295/HL/NHLBI NIH HHS/United States
- P50 AG016574/AG/NIA NIH HHS/United States
- N01 HC075150/HC/NHLBI NIH HHS/United States
- N01 HC015103/HC/NHLBI NIH HHS/United States
- N01 HC085083/HC/NHLBI NIH HHS/United States
- G0300429/MRC_/Medical Research Council/United Kingdom
- P01 AG003991/AG/NIA NIH HHS/United States
- N01 HC085085/HC/NHLBI NIH HHS/United States
- P50 AG005681/AG/NIA NIH HHS/United States
- P30 AG013846/AG/NIA NIH HHS/United States
- AG033193/AG/NIA NIH HHS/United States
- R01 HL087652/HL/NHLBI NIH HHS/United States
- N01-HC-85086/HC/NHLBI NIH HHS/United States
- NS17950/NS/NINDS NIH HHS/United States
- Z01 AG000950/ImNIH/Intramural NIH HHS/United States
- R01 DK033651/DK/NIDDK NIH HHS/United States
- N01 HC085082/HC/NHLBI NIH HHS/United States
- N01-HC-85082/HC/NHLBI NIH HHS/United States
- P30 DK063491/DK/NIDDK NIH HHS/United States
- N01 HC085080/HC/NHLBI NIH HHS/United States
- R01 AG008122/AG/NIA NIH HHS/United States
- N01 HC-55222/HC/NHLBI NIH HHS/United States
- AG05133/AG/NIA NIH HHS/United States
- M01RR00425/RR/NCRR NIH HHS/United States
- R01 AG033193/AG/NIA NIH HHS/United States
- N01 HC055222/HC/NHLBI NIH HHS/United States
- P30AG013846/AG/NIA NIH HHS/United States
- N01-HC-85083/HC/NHLBI NIH HHS/United States
- N01-HC-75150/HC/NHLBI NIH HHS/United States
- N01-HC-85080/HC/NHLBI NIH HHS/United States
- P50 AG005133/AG/NIA NIH HHS/United States
- U01 AG06576/AG/NIA NIH HHS/United States
- M01 RR000425/RR/NCRR NIH HHS/United States
- N01 HC085084/HC/NHLBI NIH HHS/United States
- R01 AG020098/AG/NIA NIH HHS/United States
- N01-AG-12100/AG/NIA NIH HHS/United States
- AG25711/AG/NIA NIH HHS/United States
- R01 AG18023/AG/NIA NIH HHS/United States
- R01 AG025259/AG/NIA NIH HHS/United States
- DK063491/DK/NIDDK NIH HHS/United States
- P01 AG003949/AG/NIA NIH HHS/United States
- AG16495/AG/NIA NIH HHS/United States
- N01-HC-85079/HC/NHLBI NIH HHS/United States
- U24 AG21886/AG/NIA NIH HHS/United States
- R01 HL064278/HL/NHLBI NIH HHS/United States
- AG20098/AG/NIA NIH HHS/United States
- N01 HC085079/HC/NHLBI NIH HHS/United States
- AG025259/AG/NIA NIH HHS/United States
- N01 HC045133/HC/NHLBI NIH HHS/United States
- P01 AG017216/AG/NIA NIH HHS/United States
- N01 HC035129/HC/NHLBI NIH HHS/United States
- R01 AG018023/AG/NIA NIH HHS/United States
- U01 AG006786/AG/NIA NIH HHS/United States
- AG17216/AG/NIA NIH HHS/United States
- AG03949/AG/NIA NIH HHS/United States
- R01 AG031287/AG/NIA NIH HHS/United States
LinkOut - more resources
Full Text Sources
Other Literature Sources
Medical
Molecular Biology Databases
Research Materials
Miscellaneous
