. 2010 Jun;7(3):036007.
doi: 10.1088/1741-2560/7/3/036007. Epub 2010 May 11.

Electroencephalographic (EEG) control of three-dimensional movement

Affiliations

Electroencephalographic (EEG) control of three-dimensional movement

Dennis J McFarland et al. J Neural Eng. 2010 Jun.

Abstract

Brain-computer interfaces (BCIs) can use brain signals from the scalp (EEG), the cortical surface (ECoG), or within the cortex to restore movement control to people who are paralyzed. Like muscle-based skills, BCIs' use requires activity-dependent adaptations in the brain that maintain stable relationships between the person's intent and the signals that convey it. This study shows that humans can learn over a series of training sessions to use EEG for three-dimensional control. The responsible EEG features are focused topographically on the scalp and spectrally in specific frequency bands. People acquire simultaneous control of three independent signals (one for each dimension) and reach targets in a virtual three-dimensional space. Such BCI control in humans has not been reported previously. The results suggest that with further development noninvasive EEG-based BCIs might control the complex movements of robotic arms or neuroprostheses.


Figures

Figure 1
Figure 1
The 3-D movement control format. The large screen image on the left shows the virtual 3-D cube with the eight possible targets in the corners and the cursor in the center. The smaller screen images show the sequence of steps in one trial: (1) a target appears; (2) 1 s later the cursor appears and moves in three dimensions controlled by the user’s EEG activity as described in the text; (3) the cursor reaches the target; (4) the target turns yellow for 1.5 s; (5) the screen is blank for 1 s and then the next trial begins. (Step 2 lasts up to 15 s. If the cursor does not reach the target in this time, the screen goes blank for 1.5 s prior to step 5.)
Figure 2
Figure 2
Percent of trials completed (i.e., target reached within 15 sec) for each user as a function of sessions. User A is represented by the blue line, user B by the black line, user C by the green, and user D by the red. Note each user’s gradual improvement over sessions.
Figure 3
Figure 3
Topographies for User 1 at the beginning (sessions 1–3), middle (sessions 10–12), and end (sessions 19–21) of 3-D training, for the correlations at each of the 64 electrodes between the spectral amplitude of the EEG and each dimension of target location. For each dimension of target location, the topography is for the 3-Hz frequency band centered at 26 Hz that provided that dimension's online control signal (i.e., Table 1). (The correlations are shown as R rather than R2 to distinguish negative and positive correlations.) “X” indicates the locations of the electrodes that provided the frequency-band amplitudes that were used online. Note the changes over time in the topographies and magnitudes of control and in the electrodes used for control. The progressive improvement in performance summarized in Figure 2 is accounted for by the increases in the user’s control in the horizontal and depth dimensions, together with the adaptive algorithm’s modifications in the electrodes used for control in the vertical and depth dimensions.
Figure 4
Figure 4
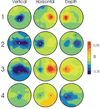
Topographies (nose at top) for each user (1–4) of the correlations for each of the 64 electrodes between the spectral amplitude of the EEG and each dimension of target location. For each dimension of target location, the topography is for the frequency band that made the largest contribution to that dimension's online control signal. (The correlations are shown as R rather than R2 to distinguish negative and positive correlations.) “X” indicates the locations of the electrodes that provided the frequency-band amplitudes that were used online. The center frequencies of the 3-Hz frequency bands of each user’s topographies are given in Table 1. While the correlations are all focused over sensorimotor cortex, they differ markedly across users as a result of inter-user differences in the course of the iterative adaptive interaction between user and system that occurs during training (see Methods). For example, User 1 controlled the three movement dimensions with 26-Hz activity from three different scalp electrodes, while User 3 controlled vertical movement with the left-right difference in 10-Hz activity, horizontal movement with 19- and 31-Hz activity at the vertex, and depth movement with 10-Hz activity on the left.
Figure 5
Figure 5
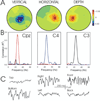
Topographical and spectral properties of EEG control for User 1. In this user, movement in each dimension was controlled by 26-Hz activity from specific scalp electrodes (Table 1). A: Scalp topographies (nose at top) of the correlations of the 26-Hz frequency band with the vertical, horizontal, and depth target locations, respectively. The electrode(s) that controlled each dimension of movement are marked. (The correlations are shown as R rather than R2 in order to distinguish negative and positive correlations.) B: Spectra for the correlations (shown as R2) of the activity at the scalp electrode that made the largest (or only) contribution to the control signal for each dimension of cursor movement with the three dimensions of target location. The correlations with the vertical, horizontal, and depth dimensions are red, blue, and black lines, respectively. It is clear that activity at the electrode that provided each control signal correlated strongly with its appropriate dimension of target location and did not correlate with the other dimensions. Furthermore, the correlation was focused in the appropriate (i.e., in this case, 26-Hz) frequency band. C: Samples of EEG activity from single trials. The traces are single 400-msec epochs of Laplacian-derived EEG from one electrode. On the left are traces from scalp electrode CPz (the major source of the vertical control signal) for trials in which the target was at the top or bottom of the cube. In the middle are traces from electrode C4 (the source of the horizontal control signal) for trials in which the target was on the right or left side of the cube. On the right are traces from electrode C3 (the source of the depth control signal) for trials in which the target was at the front or back of the cube. They illustrate the strong 26-Hz control that the user employed to move the cursor to the target.
Figure 6
Figure 6
Distributions of target-acquisition times (i.e., time from target appearance to target hit) on a 2-D center-out cursor-movement task for joystick control (black), EEG-based BCI control (blue), and cortical neuron-based BCI control (red). The EEG-based and neuron-based BCIs perform similarly, and both are slower than and much less consistent than the joystick. For both BCIs in a substantial number of trials, the target is not reached even in the 7 s allowed. Such inconsistent performance is typical of movement control by present-day BCIs, regardless of what brain signals they use. (The joystick data and neuron-based BCI data are from Hochberg et al. (2006). The EEG-based BCI data are from Wolpaw and McFarland (2004).)

References

    1. Aflalo TN, Graziano MS. Possible origins of the complex topographic organization of motor cortex: reduction of a multidimensional space onto a two-dimensional array. Journal of Neuroscience. 2006;26:6288–6297. - PMC - PubMed
    1. Andersen RA, Musallam S, Pesaran B. Selecting signals for a brain-machine interface. Curr. Opin. Neurobio. 2004;14:720–726. - PubMed
    1. Brown L, editor. The New Shorter Oxford English Dictionary. Vol. 2. Oxford: Clarenden Press; 1993. p. 2882.
    1. Bullmore E, Sporns O. Complex brain networks: graph theoretical analysis of structural and functional systems. Nature Reviews: Neuroscience. 2009;10:186–198. - PubMed
    1. Carmena JM, Lebedev MA, Crist RE, O’Doherty JE, Santucci DM, Dimitrov DF, Patil PG, Henriquez CS, Nicolelis MAL. Learning to control a brain-machine interface for reaching and grasping by primates. PloS Biol. 2003;1:1–16. - PMC - PubMed

Publication types