. 2010 May 11:6:364.
doi: 10.1038/msb.2010.18.

Metabolomic and transcriptomic stress response of Escherichia coli

Affiliations

Metabolomic and transcriptomic stress response of Escherichia coli

Szymon Jozefczuk et al. Mol Syst Biol. .

Abstract

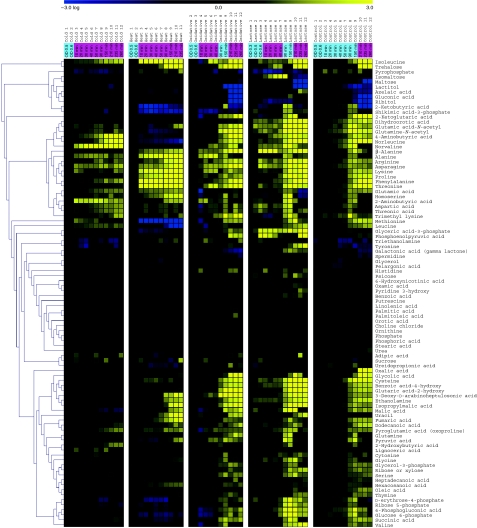
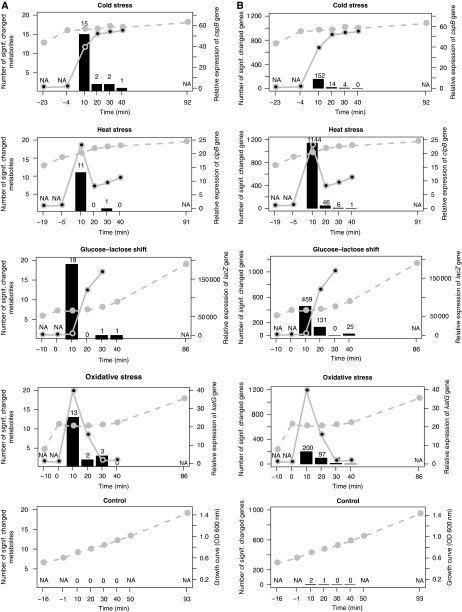
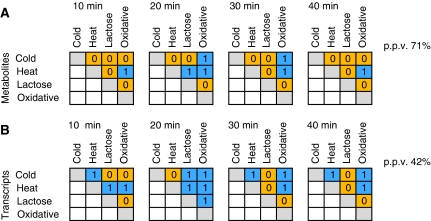
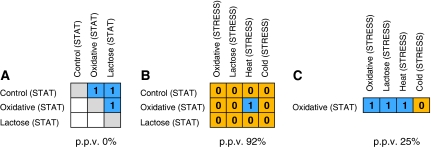
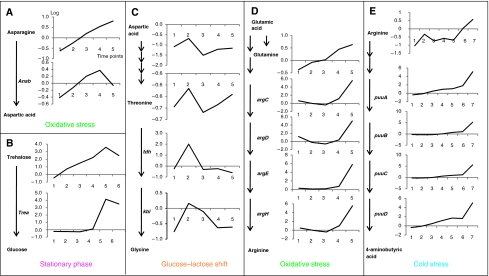
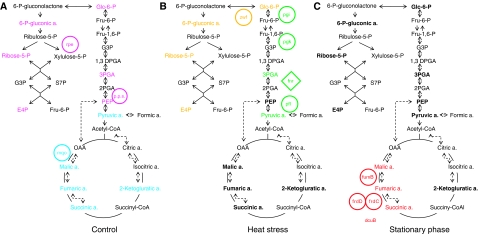
Environmental fluctuations lead to a rapid adjustment of the physiology of Escherichia coli, necessitating changes on every level of the underlying cellular and molecular network. Thus far, the majority of global analyses of E. coli stress responses have been limited to just one level, gene expression. Here, we incorporate the metabolite composition together with gene expression data to provide a more comprehensive insight on system level stress adjustments by describing detailed time-resolved E. coli response to five different perturbations (cold, heat, oxidative stress, lactose diauxie, and stationary phase). The metabolite response is more specific as compared with the general response observed on the transcript level and is reflected by much higher specificity during the early stress adaptation phase and when comparing the stationary phase response to other perturbations. Despite these differences, the response on both levels still follows the same dynamics and general strategy of energy conservation as reflected by rapid decrease of central carbon metabolism intermediates coinciding with downregulation of genes related to cell growth. Application of co-clustering and canonical correlation analysis on combined metabolite and transcript data identified a number of significant condition-dependent associations between metabolites and transcripts. The results confirm and extend existing models about co-regulation between gene expression and metabolites demonstrating the power of integrated systems oriented analysis.


Conflict of interest statement

The authors declare that they have no conflict of interest.

Figures

Figure 1
Figure 1
Metabolite changes during growth and as a result of stress treatment. Median for metabolite levels based on three independent biological repetitions of each stress condition plus control growth relative to time points before perturbation are shown in columns. Hierarchical clustering was performed on those 95 with known annotations. Within each condition, time points are ordered chronologically, the numbering refers to the numbering given in Supplementary Figure 2. Sampling time is shown in a panel at the top of the figure indicating the time after application of the different stresses in minutes. The color of the panel indicates the growth phase: blue-exponential growth, magenta-growth reduction or cessation. Time points before stress application are indicated by their optical density. Source data is available for this figure at www.nature.com/msb.
Figure 2
Figure 2
Different perturbations result in similar dynamics of responses on metabolite and transcript level. Number of changing metabolites (A) or transcripts (B) between neighboring time points is shown as a histogram for time points 10–90 min after stress (for significance threshold see Materials and methods section). The actual numbers of changes are shown above each bar. The dotted gray line indicates the growth curve, whereas the solid gray line represents the expression of genes indicative for each condition: oxidative stress-katG; heat stress-clpB; glucose-lactose shift-lacZ; cold stress-cspB).
Figure 3
Figure 3
Metabolic profiles are more stress specific as compared with the changes at gene expression level. Similarities between responses to different conditions on metabolic (A) and transcript (B) level relative to control condition. Parallel time points post-perturbation (t1: 10 min; t2: 20 min; t3: 30 min; t4: 40 min) from different experiments were compared against corresponding time points from control. The significance of the overlaps between compared conditions was calculated based on Fisher exact test. The significant overlaps (P⩽0.05) are marked by 1 (blue), whereas no significant overlaps are marked with 0 (orange). The number of significant overlaps between conditions was compared on both levels and is shown in percentage to the total number of possible comparisons. The actual number of metabolites and transcripts that overlap between compared conditions is given in Supplementary Figure 5.
Figure 4
Figure 4
Metabolite profiles of stationary phase culture differ from metabolic profile of stress-arrested cultures. Changes in metabolites during stationary phase are similar between different cultures (A) but different from metabolites changing as a result of stress (B), whereas transcripts changing during stationary phase or in response to stress are very similar (C). The significance of the overlaps between conditions was calculated based on the Fisher exact test. Significant overlaps (P⩽0.05) are marked by 1 (blue), whereas insignificant overlaps are marked with 0 (orange). The number of significant overlaps between different conditions is higher for transcript responses (PPV=25%) as compared with metabolic responses (92%). The actual number of metabolites and transcripts that overlap between conditions is given in Supplementary Figure 6.
Figure 5
Figure 5
Co-clustering between metabolic changes and transcripts of corresponding pathway genes. Representative examples (AE) of the condition specific co-clustering analysis are shown (for full list of associations see Supplementary Table 3). For the identified conditions (oxidative stress, glucose-lactose shift, cold stress), pathways with the respective genes and measured metabolites are shown in schematic way. Changes in transcript are shown next to the genes, metabolic changes next to metabolites across subsequent time points (x axis). Both changes are presented on log scale.
Figure 6
Figure 6
Visualization of the CCA results of metabolites and genes involved in primary metabolism under exponential growth. The canonical structure correlations of 69 genes and 11 metabolites covering p.p.p., glycolysis, TCA cycle, anaerobic respiration, and 8 transcriptional regulators involved in metabolic control with the first two canonical variates show two distinct groups of metabolite–transcript associations. The first group, colored in magenta, consists of metabolites from the oxidative pentose phosphate pathway (glc-6-P, 6-P-gluconic acid, ribose-5-P, and E-4-P) as well as all measured metabolites from the glycolytic pathway (3PGA and PEP in addition to glc-6-P) and the genes pps and rpe. The second group, colored in blue, consists of TCA cycle intermediates, that is 2-ketoglutaric, fumaric, malic, and succinic acids. In addition, the mqo gene encoding malate-quinone oxidoreductase (MQO) and pyruvic acid belong to this group.
Figure 7
Figure 7
Examples of the condition specific associations between metabolites and transcripts (AC). Canonical correlation analysis (CCA) reveals condition-dependent association between response dynamics on the transcript and metabolite level: comparison of metabolite–transcript associations of central metabolism between control growth, heat stress, and stationary phase. Metabolites and genes displaying a close association in the CCA were extracted (Figure 6; Supplementary Figure 8) and projected on a schematic representation of the TCA cycle, glycolytic pathway, and p.p.p. Dotted lines indicate optional anaerobic pathways. Measured metabolites are indicated in bold. Biosynthetic genes are circled and regulatory genes are displayed in diamond shape. Transcripts and metabolites showing a close association in the CCA are indicated by the same color. With respect to heat stress, a selected part of the associations are shown.

Similar articles

Cited by

References

    1. Agresti A (2002) Categorical Data Analysis. New York: John Wiley & Sons
    1. Barker MM, Gaal T, Gourse RL (2001) Mechanism of regulation of transcription initiation by ppGpp. II. Models for positive control based on properties of RNAP mutants and competition for rnap. J Mol Biol 305: 689–702 - PubMed
    1. Berg JM, Tymoczko JL, Stryer L (2006) Biochemistry. New York: W. H. Freeman
    1. Bolten CJ, Kiefer P, Letisse F, Portais JC, Wittmann C (2007) Sampling for metabolome analysis of microorganisms. Anal Chem 79: 3843–3849 - PubMed
    1. Bradley PH, Brauer MJ, Rabinowitz JD, Troyanskaya OG (2009) Coordinated concentration changes of transcripts and metabolites in Saccharomyces cerevisiae. PLoS Comput Biol 5: e1000270. - PMC - PubMed