

Chromosomal periodicity and positional networks of genes in Escherichia coli
- PMID: 20461073
- PMCID: PMC2890325
- DOI: 10.1038/msb.2010.21
Chromosomal periodicity and positional networks of genes in Escherichia coli
Abstract
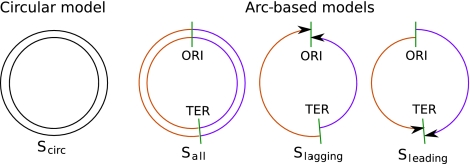
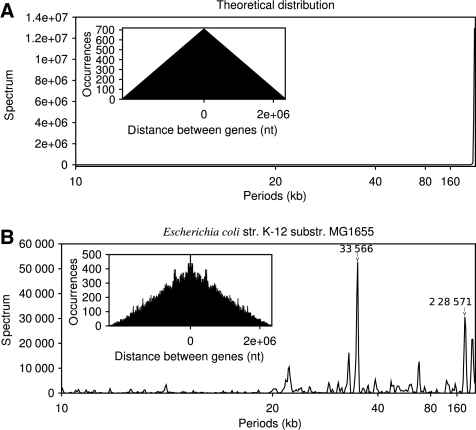
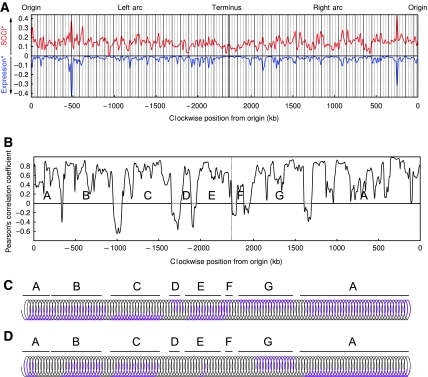
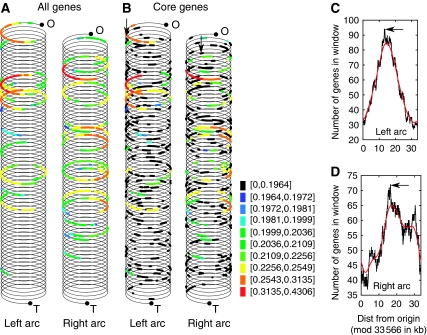
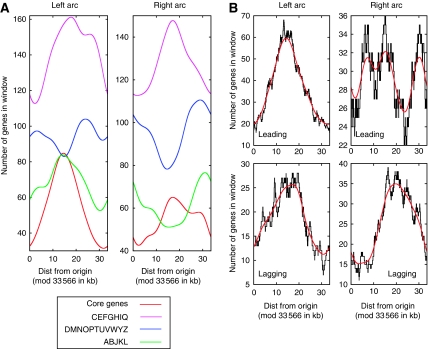
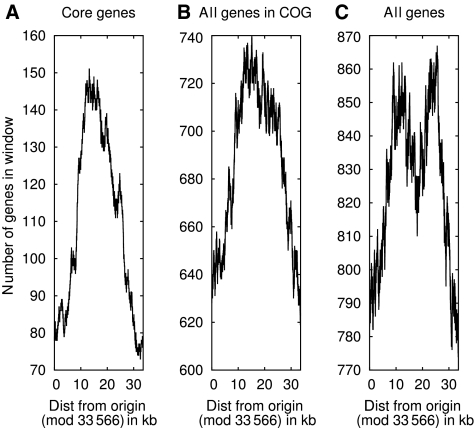
The structure of dynamic folds in microbial chromosomes is largely unknown. Here, we find that genes with a highly biased codon composition and characterizing a functional core in Escherichia coli K12 show to be periodically distributed along the arcs, suggesting an encoded three-dimensional genomic organization helping functional activities among which are translation and, possibly, transcription. This extends to functional classes of genes that are shown to systematically organize into two independent positional gene networks, one driven by metabolic genes and the other by genes involved in cellular processing and signaling. We conclude that functional reasons justify periodic gene organization. This finding generates new questions on evolutionary pressures imposed on the chromosome. Our methodological approach is based on single genome analysis. Given either core genes or genes organized in functional classes, we analyze the detailed distribution of distances between pairs of genes through a parameterized model based on signal processing and find that these groups of genes tend to be separated by a regular integral distance. The methodology can be applied to any set of genes and can be taken as a footprint for large-scale bacterial and archaeal analysis.
Conflict of interest statement
The authors declare that they have no conflict of interest.
Figures
Similar articles
-
Chromosomal periodicity of evolutionarily conserved gene pairs.Proc Natl Acad Sci U S A. 2007 Jun 19;104(25):10559-64. doi: 10.1073/pnas.0610776104. Epub 2007 Jun 11. Proc Natl Acad Sci U S A. 2007. PMID: 17563360 Free PMC article.
-
Internal versus external effector and transcription factor gene pairs differ in their relative chromosomal position in Escherichia coli.J Mol Biol. 2007 Apr 20;368(1):263-72. doi: 10.1016/j.jmb.2007.01.019. Epub 2007 Jan 12. J Mol Biol. 2007. PMID: 17321548
-
Codon usages in different gene classes of the Escherichia coli genome.Mol Microbiol. 1998 Sep;29(6):1341-55. doi: 10.1046/j.1365-2958.1998.01008.x. Mol Microbiol. 1998. PMID: 9781873
-
Chromosomal organization is shaped by the transcription regulatory network.Trends Genet. 2005 Mar;21(3):138-42. doi: 10.1016/j.tig.2005.01.003. Trends Genet. 2005. PMID: 15734572 Review.
-
Optimizing scaleup yield for protein production: Computationally Optimized DNA Assembly (CODA) and Translation Engineering.Biotechnol Annu Rev. 2007;13:27-42. doi: 10.1016/S1387-2656(07)13002-7. Biotechnol Annu Rev. 2007. PMID: 17875472 Review.
Cited by
-
DNA movies and panspermia.Life (Basel). 2011 Oct 20;1(1):9-18. doi: 10.3390/life1010009. Life (Basel). 2011. PMID: 25382053 Free PMC article.
-
Broad-scale redistribution of mRNA abundance and transcriptional machinery in response to growth rate in Salmonella enterica serovar Typhimurium.Microb Genom. 2017 Aug 4;3(10):e000127. doi: 10.1099/mgen.0.000127. eCollection 2017 Oct. Microb Genom. 2017. PMID: 29177086 Free PMC article.
-
Minimal effect of gene clustering on expression in Escherichia coli.Genetics. 2013 Feb;193(2):453-65. doi: 10.1534/genetics.112.147199. Epub 2012 Dec 5. Genetics. 2013. PMID: 23222655 Free PMC article.
-
Chromosomal organization of transcription: in a nutshell.Curr Genet. 2018 Jun;64(3):555-565. doi: 10.1007/s00294-017-0785-5. Epub 2017 Nov 28. Curr Genet. 2018. PMID: 29184972 Review.
-
Selection, periodicity and potential function for Highly Iterative Palindrome-1 (HIP1) in cyanobacterial genomes.Nucleic Acids Res. 2018 Mar 16;46(5):2265-2278. doi: 10.1093/nar/gky075. Nucleic Acids Res. 2018. PMID: 29432573 Free PMC article.
References
-
- Azam TA, Ishihama A (1999) Twelve species of the nucleoid-associated protein from Escherichia coli. Sequence recognition specificity and DNA binding affinity. J Biol Chem 274: 33105–33113 - PubMed
Publication types
MeSH terms
Substances
LinkOut - more resources
Full Text Sources
