. 2010 May 11:6:367.
doi: 10.1038/msb.2010.23.

Functional modularity of nuclear hormone receptors in a Caenorhabditis elegans metabolic gene regulatory network

Affiliations

Functional modularity of nuclear hormone receptors in a Caenorhabditis elegans metabolic gene regulatory network

H Efsun Arda et al. Mol Syst Biol. .

Abstract

Gene regulatory networks (GRNs) provide insights into the mechanisms of differential gene expression at a systems level. GRNs that relate to metazoan development have been studied extensively. However, little is still known about the design principles, organization and functionality of GRNs that control physiological processes such as metabolism, homeostasis and responses to environmental cues. In this study, we report the first experimentally mapped metazoan GRN of Caenorhabditis elegans metabolic genes. This network is enriched for nuclear hormone receptors (NHRs). The NHR family has greatly expanded in nematodes: humans have 48 NHRs, but C. elegans has 284, most of which are uncharacterized. We find that the C. elegans metabolic GRN is highly modular and that two GRN modules predominantly consist of NHRs. Network modularity has been proposed to facilitate a rapid response to different cues. As NHRs are metabolic sensors that are poised to respond to ligands, this suggests that C. elegans GRNs evolved to enable rapid and adaptive responses to different cues by a concurrence of NHR family expansion and modular GRN wiring.


Conflict of interest statement

The authors declare that they have no conflict of interest.

Figures
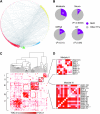
Figure 1
Figure 1
(A) C. elegans metabolic GRN. (A) Protein–DNA interaction network of C. elegans metabolic genes. Red circles—TFs; yellow diamonds—promoters of genes with Nile Red phenotypes; blue diamonds—promoters of fasting response genes; green triangles—TFs whose promoters were also analyzed; gray lines—protein–DNA interactions identified by Y1H assays. (B) Pie charts representing the percentage of NHRs in different gene-centered GRNs. Neuro—neuronal (Vermeirssen et al, 2007a); miRNA—microRNAs (Martinez et al, 2008); DT—digestive tract (Deplancke et al, 2006a). Putative novel TFs (that were specifically retrieved but that do not possess a known DNA-binding domain;Deplancke et al, 2006a) were omitted (two proportion z-test). (C) TOC clustering matrix of TFs in the metabolic gene network identifies GRN modules (roman numbers). The matrix is symmetrical across the white diagonal. Each cell that is at the intersection of two TFs represents the calculated TOC score for that TF pair. TOC scores are color coded as shown at the bottom of the panel. (D) Enlarged views of modules II and III, which predominantly contain NHRs. Source data is available for this figure at www.nature.com/msb.
Figure 2
Figure 2
Analysis of vital Nile Red staining of NHR knockdowns. (A) Examples of Nile Red phenotypes observed on NHR inactivation by RNAi. Asterisks indicate significant changes in Nile Red fluorescence compared with control animals (notice the increased fluorescent intensity). (B) Quantification of Nile Red staining-coupled RNAi experiments. Red box plots—statistically significant changes in Nile Red staining; white box plots—no significant change; dashed line—median Nile Red fluorescence in control RNAi animals. In each box plot, the central bar indicates the median, the edges of the box indicate the 25th and 75th percentiles, and the whiskers extend to the most extreme data points. For details of the statistical analysis, see ‘Materials and methods’.
Figure 3
Figure 3
Oil-Red-O staining analysis of NHR knockdown experiments. (A) Examples of Oil-Red-O stained animals. Anterior part of each animal is to the left. Black arrowheads point to the posterior bulb of the pharynx. (B) Quantifications of Oil-Red-O staining experiments. The inset at the bottom right of the figure describes graph axes. Error bars indicate the standard error of the mean (s.e.m.). The two graphs at the bottom are negative (mdt-15 RNAi) and positive controls (daf-2 RNAi).
Figure 4
Figure 4
MDT-15 specifically interacts with NHRs in the metabolic GRN. (A) Example of the Y2H matrix experiment using DB-MDT-15 bait. Indicated are the TFs that interact with MDT-15, which can grow on selective plates, inset—permissive plate. Five spots at the bottom are Y2H controls. (B) Bar graphs show the expected (solid bars) and observed (dashed bars) frequencies of TFs that interact with MDT-15 and that have a NHR-type DNA-binding domain, confer an altered Nile Red staining phenotype, or occur in the metabolic GRN (see Supplementary Table S5). (C) Images showing GFP expression in Pacdh-1∷GFP (left) and Pacdh-2∷GFP (right) transgenic animals that were subjected to control RNAi (top), nhr-10 RNAi (middle) and mdt-15 RNAi (bottom). Remaining GFP expression in Pacdh-2∷GFP animals occurs in body wall muscle. Insets in the top right corners correspond to the DIC image of the animal. (D) Bar graphs representing quantifications of intestinal GFP expression shown in (C). Error bars indicate the s.e.m.
Figure 5
Figure 5
An integrated NHR network. Interactions involving NHRs that are in module II (right, beige background) and module III (left, green background), their targets and MDT-15 are represented. NHRs that specifically bind a single target gene that is part of either module were also included. Circles—NHRs; numbers depict NHR identity, that is ‘1’ is NHR-1; NR—Nile Red staining; ORO—Oil-Red-O staining.
Figure 6
Figure 6
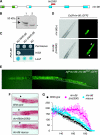
Analysis of NHR-86. (A) Gene model of nhr-86 indicating the tm2590 deletion (red rectangle), DNA-binding domain (green), and ligand-binding domain (blue). (B) Western blot using an anti-NHR-86 antibody showing that nhr-86(tm2590) mutant animals do not produce full-length NHR-86 protein (46 kDa, arrow): total protein extracts from wild-type (lane 1), or nhr-86(tm2590) mutant (lane 2) animals were used; (asterisk) non-specific band. (C) Mutant NHR-86 protein fails to bind Pnhr-86 in Y1H assays: growth on permissive media (top), HIS3 reporter (middle), and LacZ reporter expression (bottom). (D) Pnhr-86 activity determined by GFP expression in wild-type (top) or nhr-86(tm2590) mutant animals (bottom), indicating auto-repression by NHR-86 in head hypodermis and in the pharynx (white arrowheads). (E) Expression pattern and subcellular localization of NHR-86 as shown by GFP expression in transgenic animals carrying a Pnhr-86∷nhr-86ORF∷GFP reporter construct. (F) Oil-Red-O staining of wild-type, nhr-86(tm2590), and nhr-86(tm2590) animals expressing the wild-type transgene (rescue). Black arrowheads point to the posterior bulb of the pharynx. (G) Quantification of Oil-Red-O staining shown in (F). nhr-86(tm2590) animals accumulate more intensely stained lipid droplets, and this phenotype is rescued by the wild-type nhr-86 gene (see Figure 3 for a description of the graph axes).
Figure 7
Figure 7
An NHR gene circuit that responds to nutrient availability. (A) Images showing Pnhr-178 activity in wild-type and nhr-45(tm1307) animals under different feeding conditions. Graphs next to each group of images show the percentage of animals that exhibit GFP expression in the indicated tissue/cells. Error bars indicate the s.e.m. Top panels—Nomarski images; bottom panels—GFP fluorescence. White arrowheads—first anterior intestinal cells (Int1); yellow arrowheads—hypodermis. (B) Cartoon depicting effects of NHR-45 and different feeding states on Pnhr-178 activity.
Figure 8
Figure 8
Model for the organizing principles of C. elegans metabolic networks. Circles are NHRs, and hues of purple represent the evolution of HNF4 family NHRs in C. elegans. These NHRs are organized into TF modules in the metabolic GRN. NHRs regulate their metabolic target genes (blue diamonds) by interacting with ligands (hexagons), and with other proteins (orange lines) such as the cofactor MDT-15 (orange oval) and dimerization partners.

References

    1. Alon U (2007) Network motifs: theory and experimental approaches. Nat Rev Genet 8: 450–461 - PubMed
    1. Antebi A, Yeh WH, Tait D, Hedgecock EM, Riddle DL (2000) daf-12 encodes a nuclear receptor that regulates the dauer diapause and developmental age in C. elegans. Genes Dev 14: 1512–1527 - PMC - PubMed
    1. Arda HE, Walhout AJM (2010) Gene-centered regulatory networks. Brief Funct Genomic Proteomic 9: 4–12 - PMC - PubMed
    1. Ashrafi K, Chang FY, Watts JL, Fraser AG, Kamath RS, Ahringer J, Ruvkun G (2003) Genome-wide RNAi analysis of Caenorhabditis elegans fat regulatory genes. Nature 421: 268–272 - PubMed
    1. Babu MM, Luscombe NM, Aravind L, Gerstein M, Teichmann SA (2004) Structure and evolution of transcriptional regulatory networks. Curr Opin Struct Biol 14: 283–291 - PubMed

Publication types

MeSH terms

Substances