. 2010 May 11:6:368.
doi: 10.1038/msb.2010.19.

A general lack of compensation for gene dosage in yeast

Affiliations

A general lack of compensation for gene dosage in yeast

Michael Springer et al. Mol Syst Biol. .

Abstract

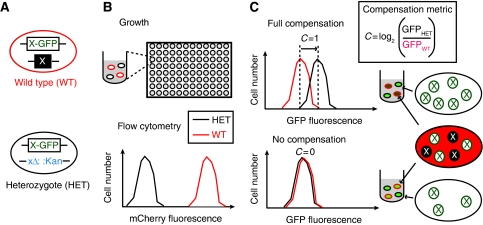
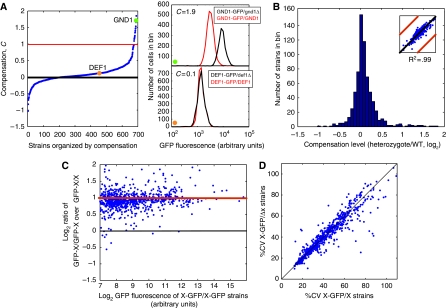
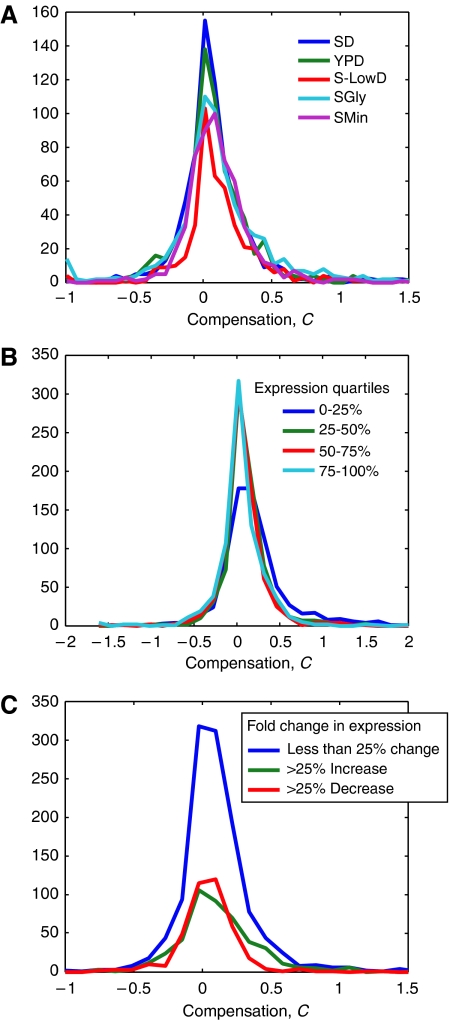
Gene copy number variation has been discovered in humans, between related species, and in different cancer tissues, but it is unclear how much of this genomic-level variation leads to changes in the level of protein abundance. To address this, we eliminated one of the two genomic copies of 730 different genes in Saccharomyces cerevisiae and asked how often a 50% reduction in gene dosage leads to a 50% reduction in protein level. For at least 80% of genes tested, and under several environmental conditions, it does: protein levels in the heterozygous strain are close to 50% of wild type. For <5% of the genes tested, the protein levels in the heterozygote are maintained at nearly wild-type levels. These experiments show that protein levels are not, in general, directly monitored and adjusted to a desired level. Combined with fitness data, this implies that proteins are expressed at levels higher than necessary for survival.


Conflict of interest statement

The authors declare that they have no conflict of interest.

Figures

Figure 1
Figure 1
Systematic analysis of protein compensation in a heterozygous strains. (A) Pairs of diploid strains were constructed where one strain is ‘wild type,' containing a single copy of a GFP fusion and constitutively expresses mCherry (WT, red-bordered cell). The matching strain is a heterozygous deletion of the GFP-fusion gene, it contains one copy of the same GFP fusion but the second copy of the gene is deleted (HET, black-bordered cells). (B) The strains were co-cultured in 96-well plates. Fluorescence from many cells was simultaneously recorded for each strain by flow cytometry and segmented into HET and WT populations (shown as a histogram). (C) The mean GFP fluorescence was calculated for each population of cells (GFPHET and GFPWT). We defined a compensation metric, C=log2 (GFPHET/GFPWT). Two hypothetical examples are shown, the top panel depicts a situation where the heterozygous strain fully compensates for the deletion of one of the two copies of its gene–C=1. The bottom panel depicts a strain that does not compensate–C=0. Details of our calculations are elaborated in the Supplementary information. As depicted on the far right, in wild-type cells, half of protein X is GFP tagged (white circles with a green X), whereas the other half is untagged (black circles with a white X). All molecules of protein X in the heterozygote strain are GFP tagged. If the protein has full compensation, the total amount of protein X should be the same in the heterozygous and wild-type strains, and therefore the amount of X-GFP will be double than that in the wild-type strain. If there is no compensation, both strains will have the same amount of X-GFP as the wild-type strain.
Figure 2
Figure 2
Quantitative flow cytometry reveals low levels of compensation for gene dosage. In these log2 plots, the black line indicates no change, whereas the red line indicates a two-fold difference between strains (in A and C) or replicate runs (in B inset). (A) The graph (left panel) shows the averaged compensation level for all replica runs for all strains in synthetic complete medium (SD) ordered by compensation level. The green circle and orange circle denote the compensation level of a compensator (GND1) and a non-compensator (DEF1), respectively. The histograms (right panel) show one experimental run for GND1 and DEF1 grown in SD medium. The heterozygous strain is show in black and the wild-type strain in red. If strains compensated fully, the ratios would be centered around the red line. Strains centered around the black line indicate no compensation. Subtle differences in the wild type versus deletion background most likely account for the 4% offset of whole population from no compensation (Supplementary information). (B) Histogram of the graph in (A) (left panel). The inset shows the reproducibility of replicate measurements. (C) Average mean expression of diploid strains where both alleles are fused to GFP (X-GFP/X-GFP) compared with diploid strains where only one of the alleles is fused to GFP (X-GFP/X). Strains centered around the red line have double the fluorescence when both alleles are tagged. (D) The percent coefficient of variance (CV) for the X-GFP/X strains is plotted against the percent CV of the X-GFP/Δx strains.
Figure 3
Figure 3
Compensation is not strongly influenced by environment or expression. (A) Histogram showing the amount of compensation from five different growth media. YPD is rich media. SGlycerol is synthetic complete media with only glycerol as a carbon source. S-LowD is synthetic complete media with low glucose. Minimal is synthetic media containing only uracil, methionine, and glutamate (no other nitrogen source). (B) Histogram of the amount of compensation (averaged log2 of the ratio of X-GFP/X over X-GFP/Δx) broken up by expression range. Strains were divided into quartile expression bins (0–25% being the lowest expressers and 75–100% being the highest expressers) based on the absolute expression of the WT strain (X-GFP/X) in SD medium. (C) Histogram of the amount of compensation binned by fold expression change from growth in SD media. Strains were divided into three bins (decreased expression, increased expression, and no change) based on two times the s.d. of the measurement error for changes in expression (Supplementary information).

Comment in

References

    1. Ashburner M, Ball C, Blake J, Botstein D, Butler H, Cherry J, Davis A, Dolinski K, Dwight S, Eppig J (2000) Gene Ontology: tool for the unification of biology. Nat Genet 25: 25–29 - PMC - PubMed
    1. Breitkreutz BJ, Stark C, Reguly T, Boucher L, Breitkreutz A, Livstone M, Oughtred R, Lackner DH, Bahler J, Wood V, Dolinski K, Tyers M (2008) The BioGRID Interaction Database: 2008 update. Nucleic Acids Res 36: D637–D640 - PMC - PubMed
    1. Breslow DK, Cameron DM, Collins SR, Schuldiner M, Stewart-Ornstein J, Newman HW, Braun S, Madhani HD, Krogan NJ, Weissman JS (2008) A comprehensive strategy enabling high-resolution functional analysis of the yeast genome. Nat Methods 5: 711–718 - PMC - PubMed
    1. Brooker RJ, Widmaier EP, Graham LE, Stiling PD (2008) Biology, 1st edn. McGraw Hill, Boston, MA, USA
    1. Cleveland DW, Lopata MA, Sherline P, Kirschner MW (1981) Unpolymerized tubulin modulates the level of tubulin mRNAs. Cell 25: 537–546 - PubMed

Publication types

Substances

LinkOut - more resources