A decision tree model for the prediction of homodimer folding mechanism
- PMID: 20461159
- PMCID: PMC2859576
- DOI: 10.6026/97320630004197
A decision tree model for the prediction of homodimer folding mechanism
Abstract
The formation of protein homodimer complexes for molecular catalysis and regulation is fascinating. The homodimer formation through 2S (2 state), 3SMI (3 state with monomer intermediate) and 3SDI (3 state with dimer intermediate) folding mechanism is known for 47 homodimer structures. Our dataset of forty-seven homodimers consists of twenty-eight 2S, twelve 3SMI and seven 3SDI. The dataset is characterized using monomer length, interface area and interface/total (I/T) residue ratio. It is found that 2S are often small in size with large I/T ratio and 3SDI are frequently large in size with small I/T ratio. Nonetheless, 3SMI have a mixture of these features. Hence, we used these parameters to develop a decision tree model. The decision tree model produced positive predictive values (PPV) of 72% for 2S, 58% for 3SMI and 57% for 3SDI in cross validation. Thus, the method finds application in assigning homodimers with folding mechanism.
Keywords: decision tree; folding; homodimer; mechanism; prediction.
Figures

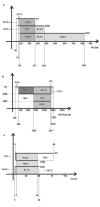
An illustration of the minimum and maximum limits of ML for 2S, 3SMI and 3SDI homodimers in the dataset is presented. The X ‐ axis represents monomer length. The overlap regions are shown horizontally. 2S proteins range from 45 to 271, 3SMI range from 72 to 381 and 3SDI range from 90 to 835.
An illustration of the minimum and maximum limits of ML for 2S, 3SMI and 3SDI homodimers in the dataset is presented. The X axis represents interface area. The overlap regions are shown horizontally. 2S proteins range from 156 to 2507, 3SMI range from 309 to 2332 and 3SDI range from 1351 to 2317.
Distribution of 2S, 3SMI and 3SDI for I/T ratio.

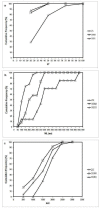
The distribution of the cumulative frequency of ML for 2S, 3SMI and 3SDI homodimers in the dataset is presented. About 90% of 2S, 60% of 3SMI and 15% of 3SDI are covered when ML ≦ 250. Hence, ML ≦250 was selected as a decision condition in the development of the model.
The distribution of the cumulative frequency of I/T ratio for 2S, 3SMI and 3SDI homodimers in the dataset is presented. About 30% of 2S and 90% of 3SMI and 3SDI are covered when I/T ≦ 25%. Hence, I/T ≦25% was selected as a decision condition in the development of the model.
The distribution of the cumulative frequency of interface area for 2S, 3SMI and 3SDI homodimers in the dataset is presented. About 50% of 2S, 70% of 3SMI and 30% of 3SDI are covered when B/2 ≦ 1500. Hence, B/2 ≦ 1500 was selected as a decision condition in the development of the model.

Similar articles
-
Structural features for homodimer folding mechanism.J Mol Graph Model. 2009 Sep;28(2):88-94. doi: 10.1016/j.jmgm.2009.04.002. Epub 2009 Apr 19. J Mol Graph Model. 2009. PMID: 19442545
-
Types of interfaces for homodimer folding and binding.Bioinformation. 2009 Sep 30;4(3):101-11. doi: 10.6026/97320630007101. Bioinformation. 2009. PMID: 20198182 Free PMC article.
-
Structural features differentiate the mechanisms between 2S (2 state) and 3S (3 state) folding homodimers.Bioinformation. 2005 Sep 2;1(2):42-9. doi: 10.6026/97320630001042. Bioinformation. 2005. PMID: 17597851 Free PMC article.
-
Folding mechanism of FIS, the intertwined, dimeric factor for inversion stimulation.J Mol Biol. 2004 Jan 23;335(4):1065-81. doi: 10.1016/j.jmb.2003.11.013. J Mol Biol. 2004. PMID: 14698300
-
Clinical prediction of thrombectomy eligibility: A systematic review and 4-item decision tree.Int J Stroke. 2019 Jul;14(5):530-539. doi: 10.1177/1747493018801225. Epub 2018 Sep 13. Int J Stroke. 2019. PMID: 30209989 Free PMC article.
Cited by
-
From Anna University to America and to Agriculture.Bioinformation. 2021 Jan 31;17(1):29-36. doi: 10.6026/97320630017029. eCollection 2021. Bioinformation. 2021. PMID: 34393415 Free PMC article.
References
LinkOut - more resources
Full Text Sources
