Review
. 2010 May-Jun;11(3):333-45.
doi: 10.3348/kjr.2010.11.3.333. Epub 2010 Apr 29.

The differential imaging features of fat-containing tumors in the peritoneal cavity and retroperitoneum: the radiologic-pathologic correlation

Affiliations
Review

The differential imaging features of fat-containing tumors in the peritoneal cavity and retroperitoneum: the radiologic-pathologic correlation

Na-young Shin et al. Korean J Radiol. 2010 May-Jun.

Abstract

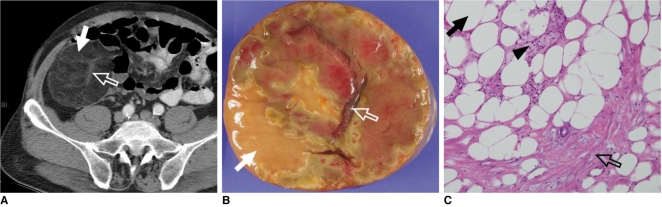
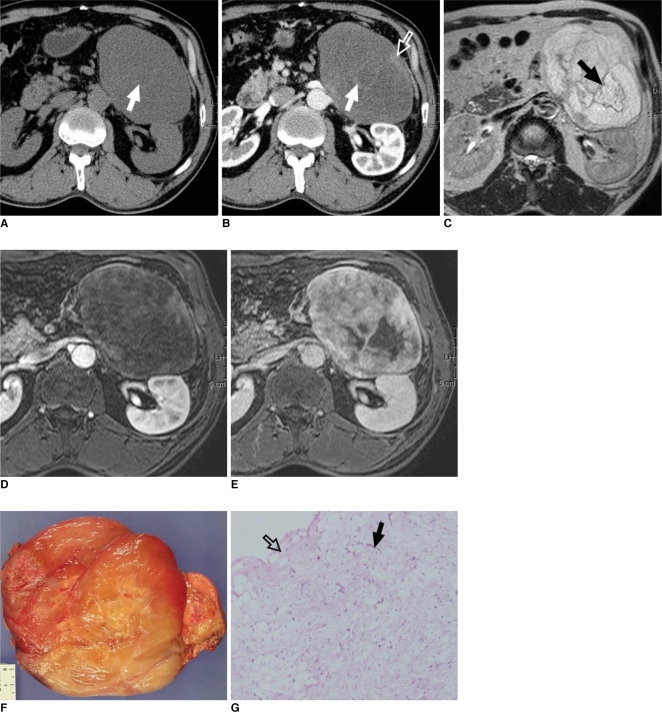
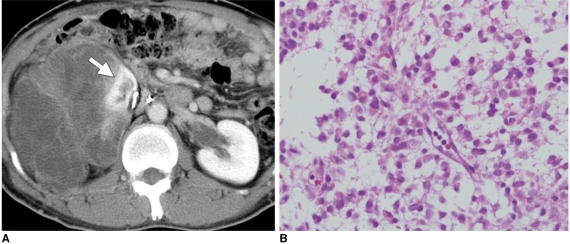
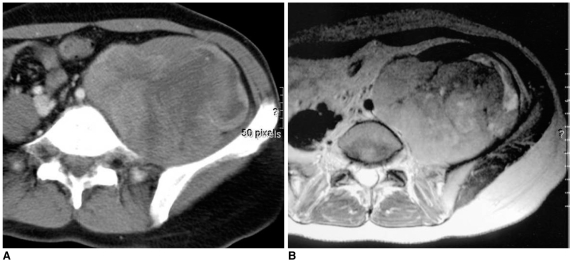
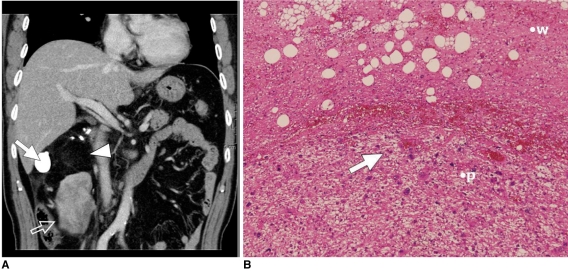
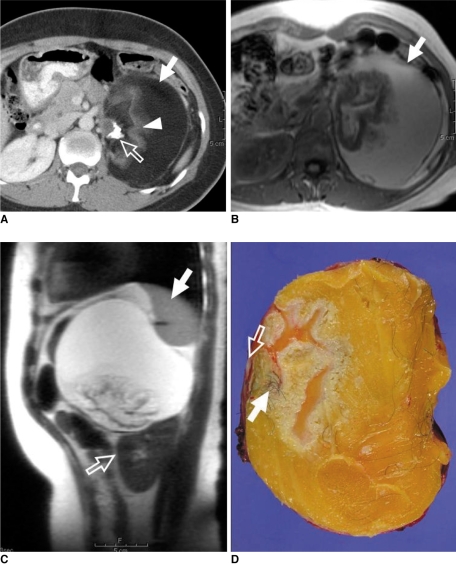
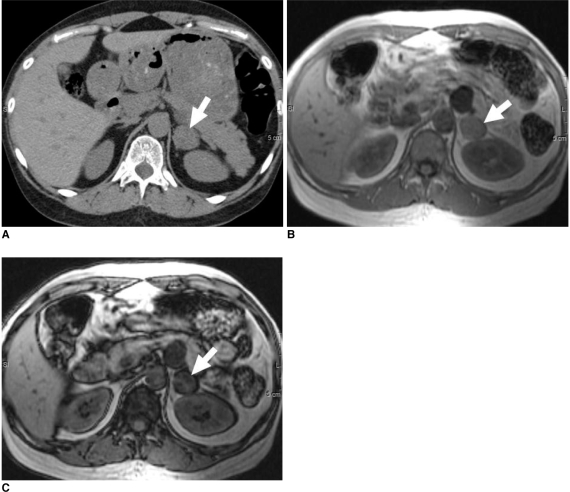
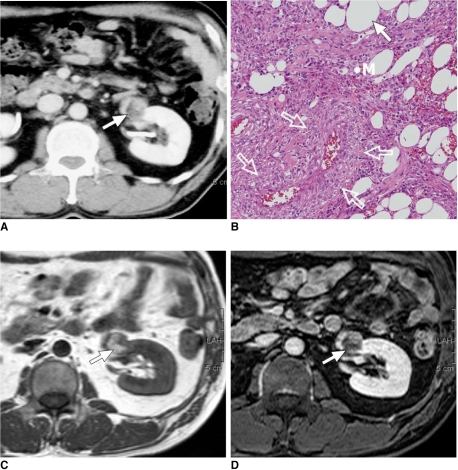
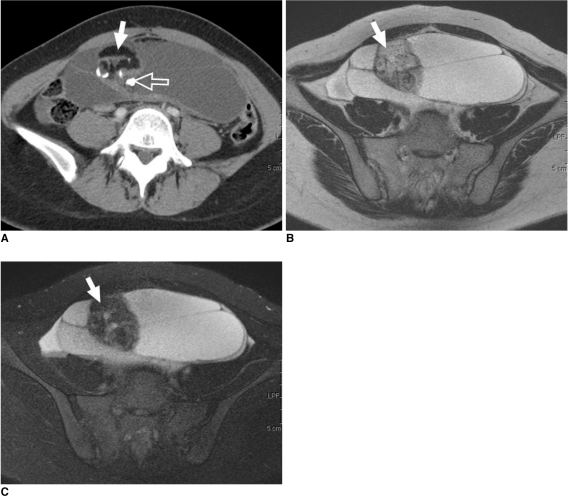
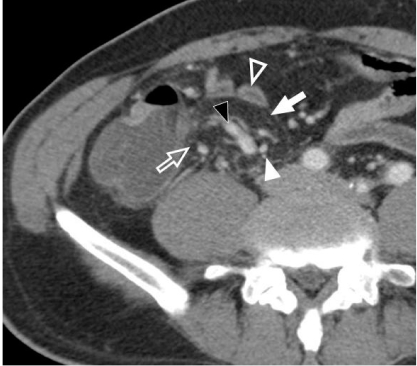
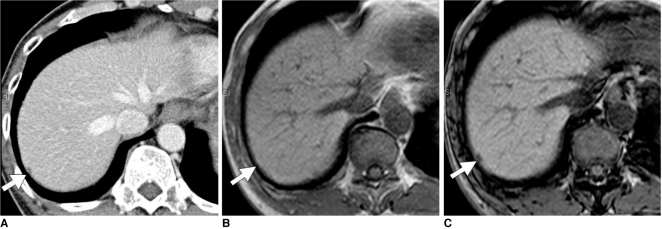
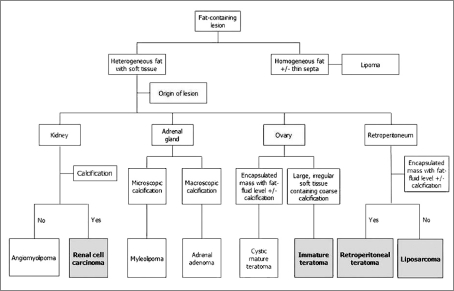
There are a variety of fat-containing lesions that can arise in the intraperitoneal cavity and retroperitoneal space. Some of these fat-containing lesions, such as liposarcoma and retroperitoneal teratoma, have to be resected, although resection can be deferred for others, such as adrenal adenoma, myelolipoma, angiomyolipoma, ovarian teratoma, and lipoma, until the lesions become large or symptomatic. The third group tumors (i.e., mesenteric panniculitis and pseudolipoma of Glisson's capsule) require medical treatment or no treatment at all. Identifying factors such as whether the fat is macroscopic or microscopic within the lesion, the origin of the lesions, and the presence of combined calcification is important for narrowing the differential diagnosis. The development and wide-spread use of modern imaging modalities make identification of these factors easier so narrowing the differential diagnosis is possible. At the same time, lesions that do not require immediate treatment are being incidentally found at an increasing rate with these same imaging techniques. Thus, the questions about the treatment methods have become increasingly important. Classifying lesions in terms of the necessity of performing surgical treatment can provide important information to clinicians, and this is the one of a radiologist's key responsibilities.

Keywords: Abdominal cavity; Magnetic resonance (MR); Neoplasm, adipose tissue; Retroperitoneal space; Tomography, spiral computed.


Figures

Fig. 1
Fig. 1
64-year-old man with pathologically proven lipoma-like, well-differentiated liposarcoma. A. Contrast-enhanced CT scan shows well-defined, heterogeneous mass with predominant fat attenuation (arrow). Slightly coarse and thickened fibrous septa (open arrow) with enhancement suggest lipoma-like, well-differentiated liposarcoma. B. Photograph of gross pathologic specimen shows homogeneously yellow adipose tissue (arrow) and septal structure (open arrow). C. Photomicrograph (Hematoxylin & Eosin staining, ×200) demonstrates mature adipocytes (arrow) that exhibit variations of cell size and multi-vacuolated lipoblasts (arrowhead) with fibrous septa (open arrow).
Fig. 2
Fig. 2
64-year-old man with pathologically proven retroperitoneal myxoid liposarcoma. A. Unenhanced transverse CT scan shows slightly inhomogeneous, hypoattenuated lesion compared with muscle, with mean CT number of 18 HU; range of attenuation was -34 HU to 66 HU. Note septae (arrow) within tumor. B. Transverse contrast-enhanced CT scan shows enhancing septae (arrow) and non-fatty tumor components (open arrow). C. Transverse T2-weighted MR image shows tumor to be hyperintense in relation to subcutaneous fat. Low signal intense septae (arrow) are also noted. D, E. Transverse gadolinium-enhanced, fat-saturated T1-weighted MR images show slowly progressive enhancement, which represents solid nature of tumor. Fibrous septae and non-fatty tumor components are markedly enhanced. F. Photograph of gross pathologic specimen shows encapsulated soft solid mass with myxoid cut surface and whitish fibrous areas. There is no definite necrotic area. G. Photomicrograph (Hematoxylin & Eosin staining, ×200) demonstrates arborizing capillaries (arrow) in myxoid background and adipocytic differentiation (open arrow) at periphery of lesion.
Fig. 3
Fig. 3
45-year-old man with pathologically proven myxoid/round cell liposarcoma. A. Axial contrast-enhanced CT scan shows heterogeneous non-fatty mass displacing right kidney superiorly and medially (arrow) with areas of hypoattenuation that represent myxoid components. B. Photomicrograph (Hematoxylin & Eosin staining, ×200) demonstrates undifferentiated round cell morphology with myxoid component.
Fig. 4
Fig. 4
30-year-old woman with pathologically proven pleomorphic liposarcoma. A. Axial contrast-enhanced CT scan shows soft tissue tumor with heterogeneous enhancement. B. Axial T2-weighted MR image shows heterogeneous, high signal intense tumor. Signal intensity is similar to or slightly lower than that of subcutaneous fat.
Fig. 5
Fig. 5
56-year-old woman with pathologically proven dedifferentiated liposarcoma. A. Coronal contrast-enhanced CT image shows non-lipomatous mass (open arrow) abruptly juxtaposed with fatty tumor (arrowhead). Mass was diagnosed as retroperitoneal soft tissue sarcoma without considering fat component as part of tumor and incomplete resection was done, which failed to remove neoplastic fat component. Considerable amount of well-differentiated liposarcoma was left. Metaplastic ossification (arrow), which is adverse prognostic factor, is also noted. B. Photomicrograph (Hematoxylin & Eosin staining, ×40) demonstrates abrupt transition from well-differentiated liposarcoma (w) to hypercellular high-grade sarcoma (p). Pleomorphic cells (arrow) are demonstrated in dedifferentiated area.
Fig. 6
Fig. 6
33-year-old woman with periadrenal mature teratoma. A. Transverse contrast-enhanced CT scan shows well encapsulated cystic mass with fat (arrow) and calcification (open arrow). Isodense, feathery appearance (arrowhead) representing hair is noted. B. Macroscopic fat component (arrow) in cystic mass shows high signal intensity on T1-weighted gradient-echo MR image. C. Sagittal T1-weighted gradient MR image shows displaced spleen (arrow) and left kidney (open arrow). D. Photograph of gross pathologic specimen shows yellowish butter-like keratinous material with hair follicles (arrow) and calcified material (open arrow).
Fig. 7
Fig. 7
33-year-old man with adrenal adenoma. A. Transverse unenhanced CT image shows well-demarcated, low-attenuation mass (arrow) in left adrenal gland. Mean CT number is 29 HU and this CT result is indeterminate. B, C. Transverse in- (B) and opposed-phase (C) chemical shift MR images show signal loss on opposed-phase image relative to that on in-phase image, finding that prompts diagnosis of adenoma (arrows).
Fig. 8
Fig. 8
48-year-old man with angiomyolipoma. A. Contrast-enhanced CT scan shows well-defined, cortically based mass with focal areas of fat attenuation (arrow). B. Photomicrograph (Hematoxylin & Eosin staining, ×100) shows adipocytes (arrow), smooth muscle cells (M) and thick-walled vessels (open arrows). C, D. These (arrows) appear hyperintense on T1-weighted MR image (C) with signal loss on gadolinium-enhanced fat saturation T1-weighted image (D).
Fig. 9
Fig. 9
44-year-old man with adrenal myelolipoma. A. Transverse contrast-enhanced CT scan shows well-defined fatty mass (arrow) in adrenal area interspersed with enhancing soft tissue components (open arrows). B. Photomicrograph (Hematoxylin & Eosin staining, ×100) shows areas of myeloid and erythroid precursor cells (open arrows) among adipocytes (arrow) within mass. Adrenal cortical cells (arrowheads) adjacent to lesion are identified.
Fig. 10
Fig. 10
19-year-old woman with mature cystic teratoma. A. On axial contrast-enhanced CT scan, well-encapsulated, multiloculated cystic and solid lesion shows fat-attenuation (arrow) with calcifications (open arrow). B, C. Heterogeneous internal signal intensity nodule on axial T2-weighted MR image (B) shows signal loss on axial fat-saturated T2-weighted MR image (C), and this represents fat component (arrows).
Fig. 11
Fig. 11
70-year-old man with acute pathologically proven mesenteric panniculitis. Axial contrast-enhanced CT scan shows ill-defined, inhomogeneous fatty mass with hyperdense peripheral stripe (arrow). Mesenteric vessels (black arrowhead) with no distortion and lymph nodes (white arrowhead) are engulfed by fatty halos (open arrow). Note smooth displacement in adjacent small bowel loops (white open arrowhead).
Fig. 12
Fig. 12
60-year-old man with pseudolipoma of Glisson's capsule. A. Axial contrast-enhanced CT scan shows well-demarcated, hypoattenuating nodule (arrow) in subcapsular region of right hepatic lobe with mean CT number of 50 HU. Lesion is not differentiated from metastatic nodule. B, C. Nodule appears with high signal intensity on in-phase MR image (B) and nodule (arrows) has signal loss on opposed-phase image (C). These findings are suggestive of fat-containing pseudolipoma of Glisson's capsule.
Fig. 13
Fig. 13
Algorithm to differentiate fat-containing lesions in intraperitoneal cavity and retroperitoneal space. Bold letters indicate lesions that require surgical resection.

Similar articles

Cited by

References

    1. Prasad SR, Wang H, Rosas H, Menias CO, Narra VR, Middleton WD, et al. Fat-containing lesions of the liver: radiologic-pathologic correlation. Radiographics. 2005;25:321–331. - PubMed
    1. Pereira JM, Sirlin CB, Pinto PS, Casola G. CT and MR imaging of extrahepatic fatty masses of the abdomen and pelvis: techniques, diagnosis, differential diagnosis, and pitfalls. Radiographics. 2005;25:69–85. - PubMed
    1. Israel GM, Bosniak MA, Slywotzky CM, Rosen RJ. CT differentiation of large exophytic renal angiomyolipomas and perirenal liposarcomas. AJR Am J Roentgenol. 2002;179:769–773. - PubMed
    1. Singer S, Antonescu CR, Riedel E, Brennan MF. Histologic subtype and margin of resection predict pattern of recurrence and survival for retroperitoneal liposarcoma. Ann Surg. 2003;238:358–370. - PMC - PubMed
    1. Weiss SW. Lipomatous tumors. In: Weiss SW, Brooks JSJ, editors. Soft tissue tumors. Baltimore: Williams & Wilkins; 1996. pp. 207–251.

MeSH terms