. 2006 Dec 1;39(6):805-811.
doi: 10.1107/S0021889806037484.

Hyperquenching for protein cryocrystallography

Affiliations

Hyperquenching for protein cryocrystallography

Matthew Warkentin et al. J Appl Crystallogr. .

Abstract

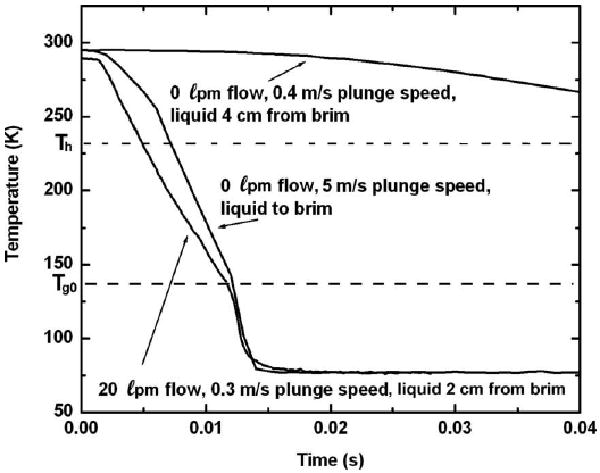
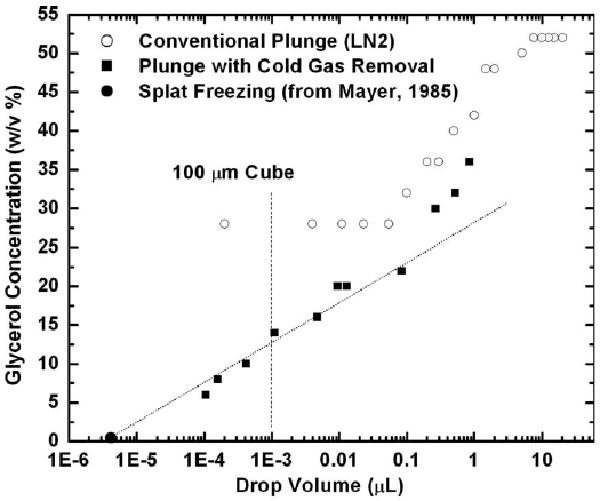
When samples having volumes characteristic of protein crystals are plunge cooled in liquid nitrogen or propane, most cooling occurs in the cold gas layer above the liquid. By removing this cold gas layer, cooling rates for small samples and modest plunge velocities are increased to 1.5 × 10(4) K s(-1), with increases of a factor of 100 over current best practice possible with 10 μm samples. Glycerol concentrations required to eliminate water crystallization in protein-free aqueous mixtures drop from ∼28% w/v to as low as 6% w/v. These results will allow many crystals to go from crystallization tray to liquid cryogen to X-ray beam without cryoprotectants. By reducing or eliminating the need for cryoprotectants in growth solutions, they may also simplify the search for crystallization conditions and for optimal screens. The results presented here resolve many puzzles, such as why plunge cooling in liquid nitrogen or propane has, until now, not yielded significantly better diffraction quality than gas-stream cooling.


Figures

Figure 1
Figure 1
Minimum glycerol concentration required for vitrification of glycerol–water mixtures versus drop volume. Open circles are data collected by plunging drops held in tungsten wire loops (for volumes above 1 μl) or in MicroMounts (below 1 μl) into liquid nitrogen without removing the cold gas layer [from Berejnov et al. (2006)]. Solid circles represent data collected by spraying drops onto the bottom of a 25 μm thick copper cup and then plunging into liquid nitrogen. Vertical lines indicate corresponding linear dimensions of cubic samples.
Figure 2
Figure 2
Gas temperature as a function of height above liquid nitrogen, held in a 12 cm diameter hemispherical Dewar, for different liquid fill levels (measured in cm from the brim). Fluctuations at large height are due to room air currents. Inset: gas temperature versus height above liquid nitrogen when dry nitrogen gas is blown along the thermocouple's path, as described in the text. Blowing reduces the thickness of the cold gas layer above the liquid from ∼2 cm to less than 100 μm: a reduction of more than two orders of magnitude. Th and Tg0 denote pure water's homogeneous nucleation temperature and glass transition temperature, respectively.
Figure 3
Figure 3
Temperature versus time recorded as a thermocouple is plunged at different velocities into a Dewar of liquid nitrogen. The liquid level is (a) 4 cm from the brim and (b) at the brim. Arrows indicate the time when the thermocouple enters the liquid. Measurements used a chromel–constantan bare-wire thermocouple with 25 μm leads and a flattened, ∼20 μm thick, bead (see text). Th and Tg0 denote pure water's homogeneous nucleation temperature and glass transition temperature, respectively.
Figure 4
Figure 4
Temperature versus time recorded as a thermocouple is plunged into liquid nitrogen, with and without cold gas layer removal by blowing. Without blowing, the plunge velocity required to minimize the effect of the gas layer is ∼5 m s−1. With blowing, very similar curves are obtained for all plunge velocities and fill heights. These measurements used the same thermocouple as in Fig. 3. Th and Tg0 denote pure water's homogeneous nucleation temperature and glass transition temperature, respectively.
Figure 5
Figure 5
Minimum glycerol concentration required for vitrification of glycerol–water mixtures versus drop volume. Open circles are the data of Fig. 1 for a direct plunge into liquid nitrogen without cold gas layer removal, taken from Berejnov et al. (2006). Solid squares are data collected for a direct plunge into liquid nitrogen using a dry nitrogen gas stream to remove the cold gas layer. These data show an approximate logarithmic variation of concentration with volume over four orders of magnitude in volume (suggesting an exponential variation of critical cooling rate with concentration). Extrapolating this variation to zero concentration roughly yields the maximum volume of pure water that can be vitrified by spraying drops onto cold copper surfaces.

Similar articles

Cited by

References

    1. Berejnov V, Husseini NS, Alsaied OA, Thorne RE. J Appl Cryst. 2006;39:244–251. - PMC - PubMed
    1. Bruggeller P, Mayer E. Nature (London) 1980;288:569–571.
    1. Chang ZH, Baust JG. J Microsc. 1991;161:435–444. - PubMed
    1. Chayen NE, Boggon TJ, Cassetta A, Deacon A, Gleichmann T, Habash J, Harrop SJ, Helliwell JR, Nieh YP, Peterson MR, Raftery J, Snell EH, Hadener A, Niemann AC, Siddons DP, Stojanoff V, Thompson AW, Ursby T, Wulff M. Q Rev Biophys. 1996;29:227–278. - PubMed
    1. Chinte U, Shah B, DeWitt K, Kirschbaum K, Pinkerton AA, Schall C. J Appl Cryst. 2005;38:412–419.