. 2010 Apr 22:4:11.
doi: 10.3389/fncir.2010.00011. eCollection 2010.

Orchestration of "presto" and "largo" synchrony in up-down activity of cortical networks

Affiliations

Orchestration of "presto" and "largo" synchrony in up-down activity of cortical networks

Francesca Gullo et al. Front Neural Circuits. .

Abstract

It has been demonstrated using single-cell and multiunit electrophysiology in layer III entorhinal cortex and disinhibited hippocampal CA3 slices that the balancing of the up-down activity is characterized by both GABA(A) and GABA(B) mechanisms. Here we report novel results obtained using multi-electrode array (60 electrodes) simultaneous recordings from reverberating postnatal neocortical networks containing 19.2 +/- 1.4% GABAergic neurons, typical of intact tissue. We observed that in each spontaneous active-state the total number of spikes in identified clusters of excitatory and inhibitory neurons is almost equal, thus suggesting a balanced average activity. Interestingly, in the active-state, the early phase is sustained by only 10% of the total spikes and the firing rate follows a sigmoidal regenerative mode up to peak at 35 ms with the number of excitatory spikes greater than inhibitory, therefore indicating an early unbalance. Concentration-response pharmacology of up- and down-state lifetimes in clusters of excitatory (n = 1067) and inhibitory (n = 305) cells suggests that, besides the GABA(A) and GABA(B) mechanisms, others such as GAT-1-mediated uptake, I(h), I(NaP) and I(M) ion channel activity, robustly govern both up- and down-activity. Some drugs resulted to affect up- and/or down-states with different IC(50)s, providing evidence that various mechanisms are involved. These results should reinforce not only the role of synchrony in CNS networks, but also the recognized analogies between the Hodgkin-Huxley action potential and the population bursts as basic mechanisms for originating membrane excitability and CNS network synchronization, respectively.

Keywords: GABA; IM channels; INaP channels; Ih channels; MEA recording; bursts; synchrony.


Figures

Figure 1
Figure 1
GABAergic population in cortical cultures at DIV15. Confocal microscopical analysis of double immunofluorescence staining for MAP2 (neuronal marker, red signal) and GABA (green signal). In (A,D) MAP2 labelling shows the distribution of neuronal cells in clusters (arrows) in two sampled fields, where GABA immunocytochemistry (B,E) selects inhibitory neurons (yellow signal in merge, C and F). Large GABAergic cells (green arrows) are preferentially localized among clusters, whereas small GABAergic cells (green arrowheads) lie also inside these neuronal groups. Scale bar: 67 μm.
Figure 2
Figure 2
The effects of the GABAA disinhibition by GABAzine (GBZ). (A,B) dose–response curves for IBI and BD evaluated for the excitatory (red symbols) and inhibitory (black symbols) cluster of neurons (total number of cells: 187, 68, respectively). (C) From a single experiment with two clusters of 69 excitatory (red) and 24 inhibitory (black), the cumulative histograms of BD are shown under control (left), in 200 nM (middle) and in 3 μM GBZ. In control average data of BD and IBI for the excitatory (inhibitory) clusters were 0.17 ± 0.02 s (0.64 ± 0.07 s) and 11.4 ± 0.6 s (9.7 ± 0.37 s), respectively. (D) From the same network of (C), the cluster SR versus the time after the burst start are plotted (mean values, red and black for excitatory and inhibitory clusters; data evaluated every 5 ms), in control (left), at 200 nM (middle) and at 3 μM GBZ (right) as indicated for the excitatory (red) and inhibitory (black) neurons. Insets to each graph illustrate how the same data appear after division by the number of cells in each cluster (nSR on y-scale). Cubic B-spline option was used. (E) The difference between the number of spikes produced by the excitatory and inhibitory clusters shown in (D) is plotted in control (black), at 200 nM (green) and at 3 μM GBZ (blue). The small rectangle indicates the zoomed region shown in inset where the oscillatory behaviour data, at 3 μM GBZ from 200 to 400 ms, of cluster-SR difference is shown with bar errors. (F) From the same data shown in (D), the cumulative histograms versus the time after the burst start are plotted (mean values, red and black for excitatory and inhibitory clusters; data evaluated every 5 ms), in control (left), at 200 nM (middle) and at 3 μM GBZ (right) as indicated for the excitatory (red) and inhibitory (black) neurons.
Figure 3
Figure 3
Effects of baclofen and SKF89976A. (A–D) Effects of baclofen. (A,B) Dose–response curves for IBI and BD evaluated for the excitatory (red symbols) and inhibitory (black symbols) cluster of neurons (total number of cells: 153, 33, respectively). (C) For one of the three experiments and the two related cell clusters, the BD cumulative probability is shown in control, 100, 300 nM and in 1 μM BAC (see legend for different line styles). The average values of BD for the two clusters were 88 ± 4 and 286 ± 6 ms in control and 276 ± 15 and 737 ± 73 ms in 1μM BAC, n = 42 and 13 respectively. (D) From the same experiment shown in (C), the cSR data are shown superimposed for the above concentrations for excitatory (left) and inhibitory (right) clusters. (E–H) Effects of SKF89976A. (E,F) Dose–response curves for IBI and BD evaluated for the excitatory (red symbols) and inhibitory (black symbols) cluster of neurons (total number of cells: 169, 39, respectively). After the highest SKF concentration, a dose of 3 μM CGP was added on top and the corresponding data are shown as triangular symbols. (G) For one of the three experiments and the two cell clusters, the BD cumulative histograms are shown in control (left panel), in 30 nM (middle) and in 3 μM (right) SKF. Arrows indicate the mean values. Data with triangles show the results after the CGP addition on top of SKF. For the same experiment shown, the BD values for the excitatory (inhibitory) clusters were: 45 ± 5 (212 ± 34 ms) ms in control, 73 ± 17 (450 ± 99 ms) ms in 30 nM SKF and 121 ± 13 (257 ± 48 ms) ms in 3 μM SKF, n = 52 and 11 respectively. The average IBI values for the two clusters were: 6.7 ± 0.2 and 5.8 ± 0.3 s in control, 5.5 ± 0.32 and 3.9 ± 0.23 s in 30 nM SKF and 19.3 ± 0.6 and 18.3 ± 0.98 s in 3 μM SKF. (H) From the same experiment shown in (G), the average cSR recorded during the bursts in control (left) and in 30 nM (middle, dotted lines replicate data in control) and 3 μM (right) SKF. In the last panel the data of the effect of adding 3 μM CGP on top of SKF is shown, as indicated, in triangle + line legend.
Figure 4
Figure 4
The effects of blocking Ih (with ZD7288) and enhancing IM (with ICA-27243) currents. (A–D) Effects of ZD. (A,B) Dose–response curves for IBI and BD evaluated for the excitatory (red symbols) and inhibitory (black symbols) cluster of neurons (total number of cells: 192, 45, respectively). (C) BD cumulative histogram data from one of the three experiments with 36 excitatory (left) and 13 inhibitory (right) cells. Arrows indicate the temporal sequence during the experiment. For the single experiment shown, mean values of IBI and BD (in parenthesis the inhibitory cells) in control were, respectively: 8.3 ± 0.3 s (7.4 ± 0.3); 61 ± 7 ms (405 ± 68), n = 36 (n = 13). The values in 10 μM GBZ were: 10.2 ± 0.4 s (15.5 ± 0.6); 374 ± 60 ms (1430 ± 0.8) and in 10 μM ZD were: 22.2 ± 1.3 s (19.2 ± 0.75); 70 ± 17 ms (450 ± 61). (D) nSR (neuron-normalized cSR in each cluster) is plotted versus burst duration, for excitatory (left) and inhibitory (right) typical cells. Thin, medium and thick lines are used to distinguish control, 10 μM GBZ and 10 μM ZD on top, respectively. Inset illustrates the cSR difference between excitatory and inhibitory clusters. (E–H) Effects of ICA-27243. (E,F) Dose–response curves for IBI and BD evaluated for the excitatory (red symbols) and inhibitory (black symbols) clusters of neurons (total number of cells: 190, 52, respectively). (G) Cumulative histogram of IBI (left) and BD (right), respectively for excitatory (red) and inhibitory (black) cells in control and at the indicated concentrations. For the single experiment shown, mean values of IBI and BD (in parenthesis the inhibitory cells) in control were, respectively: 17.1 ± 2.3 s (12.1 ± 0.6); 98 ± 14 ms (619 ± 82 ms), n = 52 (n = 14); in 100 nM ICA: 16.2 ± 2.4 s (11.8 ± 1.2 s); 64 ± 8 ms (280 ± 30 ms); in 10 μM ICA: 19.6 ± 2.9 s (14.9 ± 0.7 s); 86 ± 10 ms (260 ± 20 ms). (H) Plot of cSR in excitatory (left) and inhibitory (right) cells in control (thin lines), at 100 nM (medium lines) and at 10 μM ICA (thick lines), respectively. Inset: the difference of SR between excitatory and inhibitory clusters.
Figure 5
Figure 5
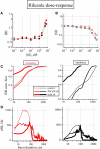
The dose–response effects of riluzole. (A,B) Dose–response curves for IBI and BD evaluated for the excitatory (red symbols) and inhibitory (black symbols) cluster of neurons (total number of cells: 176, 68, respectively). (C) BD cumulative histogram data from one representative experiment out of four experiments with 44 excitatory (left) and 17 inhibitory (right) cells. Data are shown in thin, medium and thick lines for control, 300 nM and 5 μM ril, respectively. For the single experiment shown, mean values of IBI and BD (in parenthesis the inhibitory cells) in control were, respectively: 25 ± 1.3 s, (23 ± 1.6); 100 ± 15 ms (602 ± 34). The values in 300 nM ril were: 31 ± 2 s, (26.8 ± 0.9); 83 ± 10 ms (331 ± 29) and in 5 μM ril were: 83.3 ± 6 s, (81.8 ± 8); 15 ± 2.6 ms (30 ± 9). (D) cSR is plotted versus burst duration, for excitatory (left) and inhibitory (right) cells. Data are shown in thin, medium and thick lines for control, 300 nM and 5 μM ril, respectively.

Similar articles

Cited by

References

    1. Ahn H. S., Choi J. S., Choi B. H., Kim M. J., Rhie D. J., Yoon S. H., Jo Y. H., Kim M. S., Sung K. W., Hahn S. J. (2005). Inhibition of the cloned delayed rectifier K+ channels, Kv1.5 and Kv3.1, by riluzole. Neurosci 133, 1007–101910.1016/j.neuroscience.2005.03.041 - DOI - PubMed
    1. Baddeley R., Abbot L. F., Booth M. C., Sengpiel F., Freeman T., Wakeman E. A., Rolls E. (1997). Responses of neurons in primary and inferior temporal visual cortices to natural scenes. Proc. R. Soc. Lond., B, Biol. Sci. 264, 1775–178310.1098/rspb.1997.0246 - DOI - PMC - PubMed
    1. Barthò P., Hirase H., Monconduit L., Zugaro M., Harris K. D., Buzsáki G. (2004). Characterization of neocortical principal cells and interneurons by network interactions and extracellular features. J. Neurophysiol. 92, 600–60810.1152/jn.01170.2003 - DOI - PubMed
    1. Beggs J. M., Plenz D. (2003). Neuronal avalanches in neocortical circuits. J. Neurosci. 23, 11167–11177 - PMC - PubMed
    1. Beggs J. M., Plenz D. (2004). Neuronal avalanches are diverse and precise activity patterns that are stable for many hours in cortical slice cultures. J. Neurosci. 24, 5216–522910.1523/JNEUROSCI.0540-04.2004 - DOI - PMC - PubMed