. 2010 Oct;67(19):3299-311.
doi: 10.1007/s00018-010-0379-6. Epub 2010 May 12.

Bimodal expression of Sprouty2 during the cell cycle is mediated by phase-specific Ras/MAPK and c-Cbl activities

Affiliations

Bimodal expression of Sprouty2 during the cell cycle is mediated by phase-specific Ras/MAPK and c-Cbl activities

Christoph-Erik Mayer et al. Cell Mol Life Sci. 2010 Oct.

Abstract

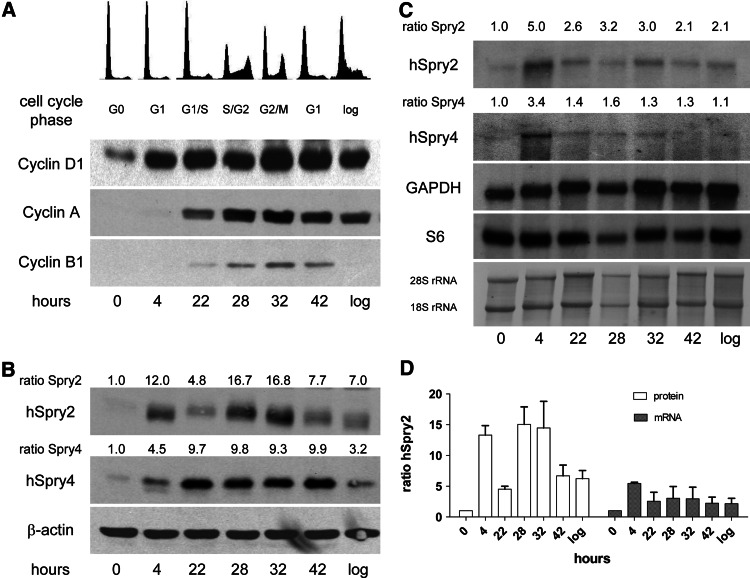
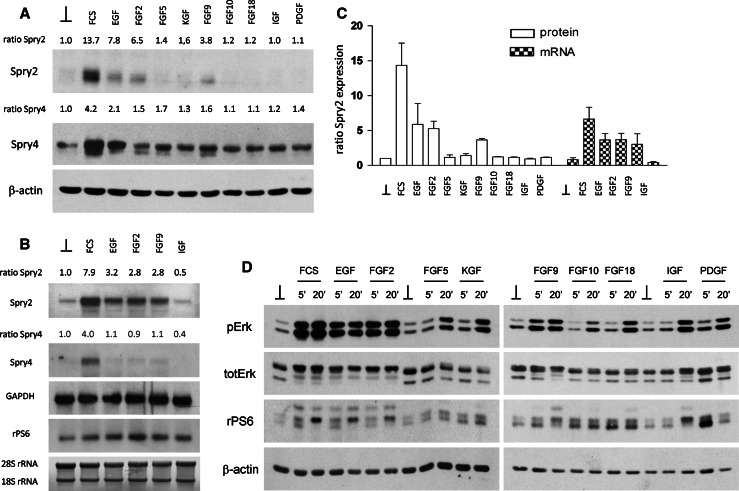
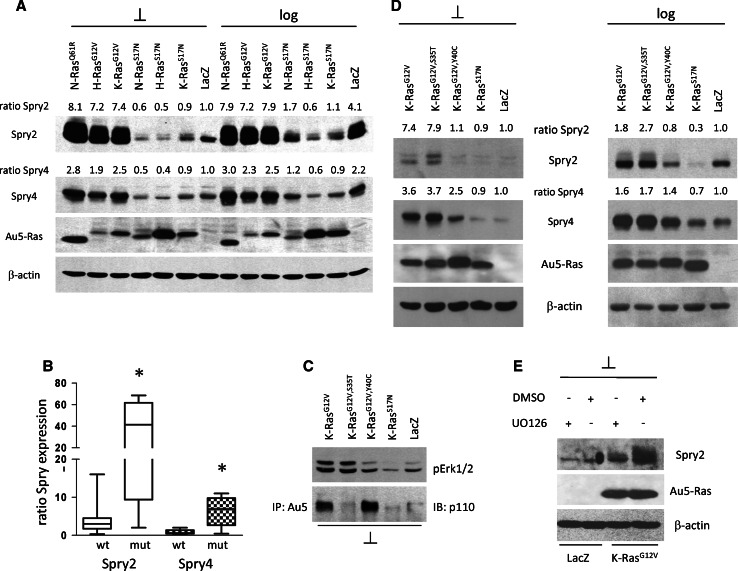
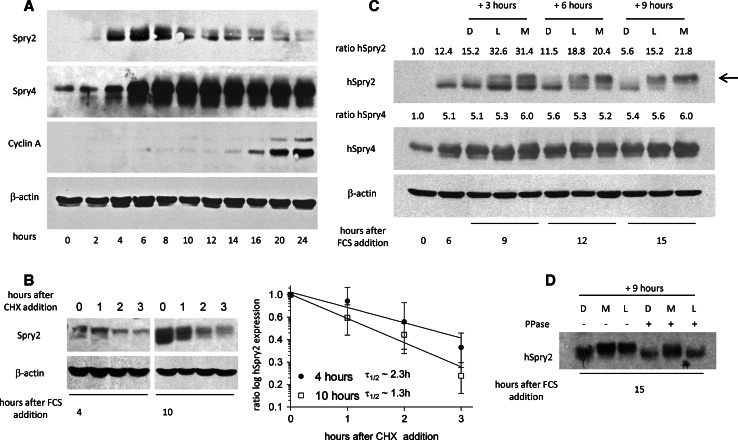
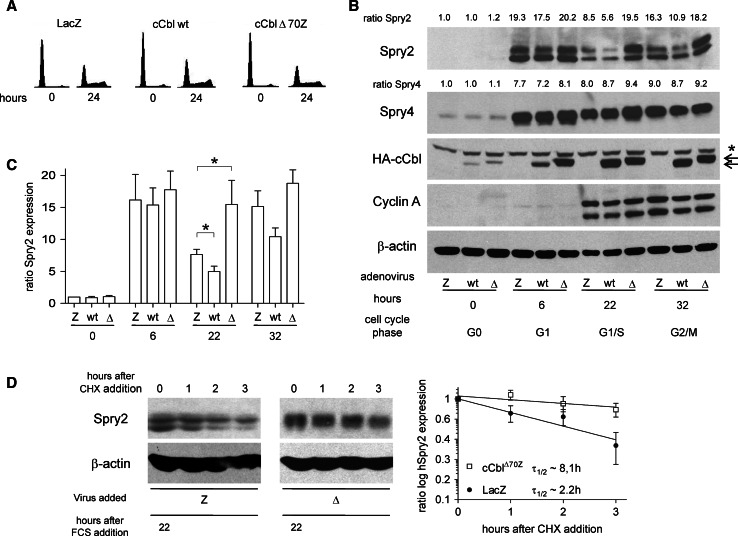
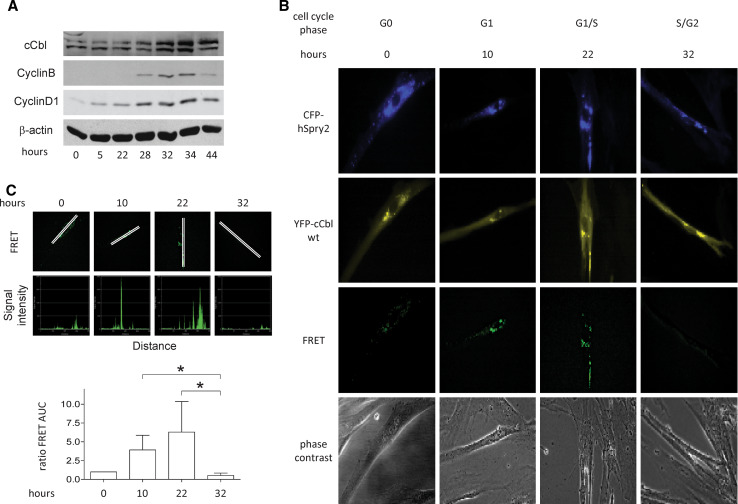
Sprouty2 is an important inhibitor of cell proliferation and signal transduction. In this study, we found a bimodal expression of Sprouty2 protein during cell cycle progression after exit from quiescence, whereas elevated Sprouty4 expression in the G1 phase stayed high throughout the rest of the cell cycle. Induction of the mitogen-activated protein kinase via activated Ras was crucial for increased Sprouty2 expression at the G0/G1 transition. Following the first peak, accelerated proteasomal protein degradation caused a transient attenuation of Sprouty2 abundance during late G1. Since the decline in its expression was abolished by dominant negative c-Cbl and the timely restricted interaction between Sprouty2 and c-Cbl disappeared at the second peak of Sprouty2 expression, we conclude that the second phase in the cell cycle-specific expression profile of Sprouty2 is solely dependent on ubiquitination by c-Cbl. Our results suggest that Sprouty2 abundance is the result of strictly coordinated activities of Ras and c-Cbl.


Figures

Fig. 1
Fig. 1
Spry2 and Spry4 expression after cell cycle induction of serum-deprived WI-38 cells. WI-38 cells were synchronized in the G0/G1 phase by culture in medium without serum. They were released from quiescence by adding medium containing 20% FCS. a At the indicated time points, cells were analysed by FACS. In parallel isolated total protein was separated by SDS-PAGE, and probed with antibodies recognizing cyclin D1, cyclin A and cyclin B1 proteins. b The same samples were probed with Spry2- and Spry4-specific antibodies. Equal loading was confirmed using β-actin as a control. Spry expression levels were determined by densitometry analysis and normalized to β-actin. Starved cells were set arbitrarily to 1. c In parallel, cytoplasmic RNA was extracted from part of the cells and northern blotting was performed using 32P-labelled cDNA probes specific for Spry2, Spry4 and rpS6. Since intensity signals derived from hybridization with rpS6 changed, methylene blue staining and hybridization with GAPDH were added as further loading controls. The expression level ratios of Spry2 and Spry4 were calculated and normalized to rpS6 and GAPDH, respectively. The mean values of both standardizations are indicated. Starved cells were set arbitrarily at 1 in each case. d Calculated Spry2 protein and mRNA expression levels during the cell cycle of WI-38. Each column represents the mean of at least three independent experiments including the standard deviation
Fig. 2
Fig. 2
Growth factor-mediated induction of Spry protein and mRNA expression in human WI-38 fibroblasts. Normal human WI-38 fibroblasts were serum-deprived for 3 days before the indicated growth factors were added for 5 h (a, b), and 5 and 20 min (d), respectively. Protein lysates were prepared for immunoblotting (a, d) using the indicated antibodies. mRNA was analysed via northern blot (b) using 32P-labelled full-length Spry2, Spry4 and rPS6 as probes. The expression level ratios of Spry were calculated after densitometric analysis normalized to either β-actin (a) or rPS6 and GAPDH (b). Serum-deprived cells were set to 1. c Summary of three or four experiments. The means and SDs of calculated and normalized Spry2 expression levels are shown
Fig. 3
Fig. 3
The influence of K-Ras on expression of Spry2 and Spry4. a Serum-deprived and logarithmically growing WI-38 cells were infected using adenoviruses expressing different oncogenic Ras proteins. LacZ and the respective dominant-negative RasS17N adenoviruses were included in the experiment. Cells were harvested after 3 days and equal amounts of protein were separated via SDS-PAGE, transferred onto a nitrocellulose membrane and immunoblotting was performed using the indicated antibodies. A representative immunoblot of two independent experiments is shown. Protein levels were quantified by densitometric analyses and normalized to β-actin and serum-starved LacZ-infected cells. b Endogenous Spry protein expression was analysed in 15 NSCLC-derived tumour cell lines. All cells were serum-deprived for 2 days before harvesting. Equal amounts of protein were used for immunoblotting. After densitometric analysis the protein levels were normalized to β-actin. WI-38 cells were arbitrarily set to 1. The results are presented as a box and whiskers diagram and statistical analyses were performed using the Mann–Whitney U test. *P < 0.05. c Serum-deprived WI-38 cells were infected with adenoviruses expressing the indicated Ras mutations: upper row activation of Ras/MAPK was measured via immunoblotting using phospho-ERK-specific antibody; lower row binding of Ras to PI3K was determined via AU5 immunoprecipitation and subsequent immunoblotting using p110PI3K antibodies. d In parallel, expression of Spry2 and Spry4 was determined in serum-deprived WI-38 cells (left panel) and in logarithmically growing WI-38 cells (right panel) infected with the indicated adenoviruses via immunoblotting using specific antibodies. The Spry2 and Spry4 ratios were calculated via densitometric analysis and normalized to β-actin and LacZ-infected cells, respectively. e WI-38 cells were serum-deprived and infected with adenoviruses expressing lacZ or K-RasG12V. At 10 h prior to harvesting MEK inhibitor U0126 or the organic solvent DMSO were added to the cells. Immunoblotting was performed using the indicated antibodies (⊥ serum-deprived cells, log logarithmically growing cells)
Fig. 4
Fig. 4
Influence of proteasome-mediated degradation on Spry protein expression between G0 and S phase. WI-38 cells were serum-deprived for 3 days to mediate a cell cycle arrest in G0/G1. Cell cycle entry was induced by medium containing 20% FCS. a Total protein was isolated at the indicated time points after serum addition. Equal amounts of the protein lysates were separated by SDS-PAGE and blotted onto nitrocellulose membrane. Spry-specific antibodies were used to detect the levels of Spry2 and Spry4 proteins. Cyclin A and β-actin were used as controls. b At the time points 4 h (left panel) and 10 h (right panel) after serum induction CHX was added to the cells. Total protein was isolated at the indicated times and equal amounts of protein were analysed by immunoblotting. A representative blot is shown. Densitometric data for Spry2 protein levels were normalized to β-actin and half-lives were calculated from three independent experiments using ImageQuant and GraphPad Prism software. c At 6 h after cell cycle release from quiescence, 100 μM of the proteasome inhibitors LLnL and MG-132 (dissolved in DMSO) were added for 3, 6 or 9 h, and compared to DMSO-treated WI-38 cells. The cells were harvested at the indicated times, processed for immunoblotting and stained with Spry2- and Spry4-specific antibodies. Note the appearance of a Spry2 band migrating more slowly (arrow) after proteasome inhibitor treatment. The ratios of the abundances of Spry2 and Spry4 proteins were calculated by densitometric analysis and normalized to β-actin and quiescent, untreated cells, respectively. d Extracts from cells harvested 15 h after serum induction and 9 h after addition of proteasome inhibitors were either mock-treated or incubated with shrimp alkaline phosphatase. (D DMSO-treated cells, L LLnL-treated cells, M MG-132-treated cells)
Fig. 5
Fig. 5
Influence of c-Cbl on Spry2 cell cycle-specific expression. Serum-deprived WI-38 cells were infected with the indicated viruses and induced by adding medium containing 20% serum. a Cells were trypsinized and prepared for FACS analysis at 0 h and after 24 h of induction. b In parallel the cells were harvested at the indicated time points representing the indicated phases of the cell cycle. Total protein was isolated, separated by SDS-PAGE and blotted onto nitrocellulose membrane and probed using the indicated antibodies. The ratios of Spry2 and Spry4 were calculated by densitometric analysis and normalized to β-actin. Arrested control cells were arbitrarily set to 1 (asterisk nonspecific band recognized by the 12CA5 antibody, arrows specific bands for the HA-cCbls). c The calculated Spry2 protein levels of WI-38 cells infected with viruses expressing lacZ, c-Cbl wt or dominant-negative cCblΔ70Z mutant are compared. Each column represents the means of at least three independent experiments and includes the standard deviation. *P < 0.05 (Mann–Whitney U test). d Cells infected with viruses coding for LacZ or the dominant-negative cCblΔ70Z were serum-induced for 22 h before CHX was added for the indicated times. Protein half-lives were calculated after densitometric analysis of two independent results (wt cCblwt, Δ dominant-negative cCblΔ70Z, Z LacZ control virus)
Fig. 6
Fig. 6
FRET analysis of Spry2 and c-Cbl interaction during specific cell cycle phases. WI-38 cells were serum-deprived for 3 days and synchronized in G0/G1 phase. a By addition of medium containing 20% serum, cells were released and analysed by immunoblotting at the indicated times. b At 48 h prior to FRET analyses, serum-starved cells were infected with adenoviruses expressing CFP-labelled Spry2 and YFP-labelled HA-c-Cblwt. Quiescent cells were induced using 20% serum for the indicated times. In all cases the proteasome inhibitor LLnL was added to a final concentration of 50 μM 2 h prior to the FRET analyses. Images were acquired with filters for CFP (cyan), YFP (yellow), and for FRET using identical microscope and camera settings. After determination of the correction factor for CFP (donor) and YFP (acceptor), the intensity of the FRET signal (green) was calculated [25]. Representative examples are shown. c Intensity profiles (lower panels) of the FRET signals along an arbitrary line across the cell (upper panels) presented as calculated grey level (y-axis) versus pixel distance (x-axis). For statistical analysis the areas under the curve of the line scans were quantified using ImageQuant. Each bar represents the mean ± SD of at least eight images from three independent experiments. *P < 0.05 (Mann–Whitney U test)

Similar articles

Cited by

References

    1. Hacohen N, Kramer S, Sutherland D, Hiromi Y, Krasnow MA. Sprouty encodes a novel antagonist of FGF signaling that patterns apical branching of the Drosophila airways. Cell. 1998;92:253–263. doi: 10.1016/S0092-8674(00)80919-8. - DOI - PubMed
    1. Nutt SL, Dingwell KS, Holt CE, Amaya E. Xenopus Sprouty2 inhibits FGF-mediated gastrulation movements but does not affect mesoderm induction and patterning. Genes Dev. 2001;15:1152–1166. doi: 10.1101/gad.191301. - DOI - PMC - PubMed
    1. Chambers D, Mason I. Expression of sprouty2 during early development of the chick embryo is coincident with known sites of FGF signalling. Mech Dev. 2000;91:361–364. doi: 10.1016/S0925-4773(99)00288-9. - DOI - PubMed
    1. Minowada G, Jarvis LA, Chi CL, Neubuser A, Sun X, Hacohen N, Krasnow MA, Martin GR. Vertebrate Sprouty genes are induced by FGF signaling and can cause chondrodysplasia when overexpressed. Development. 1999;126:4465–4475. - PubMed
    1. Furthauer M, Lin W, Ang SL, Thisse B, Thisse C. Sef is a feedback-induced antagonist of Ras/MAPK-mediated FGF signalling. Nat Cell Biol. 2002;4:170–174. doi: 10.1038/ncb750. - DOI - PubMed

Publication types

LinkOut - more resources