. 2010 Feb 24;10(2):23.1-15.
doi: 10.1167/10.2.23.

(In) sensitivity to spatial distortion in natural scenes

Affiliations

(In) sensitivity to spatial distortion in natural scenes

Peter J Bex. J Vis. .

Abstract

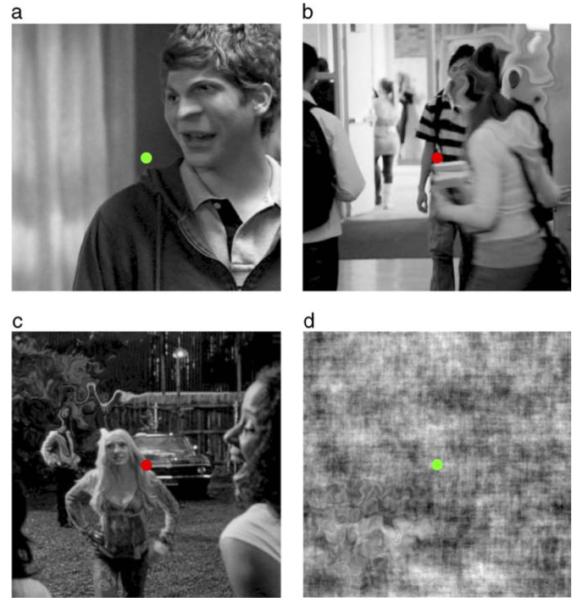
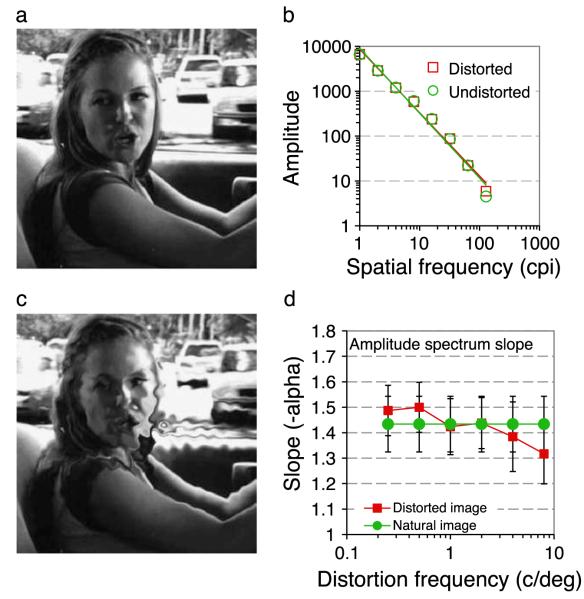
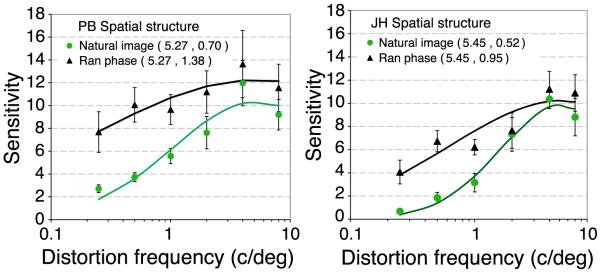
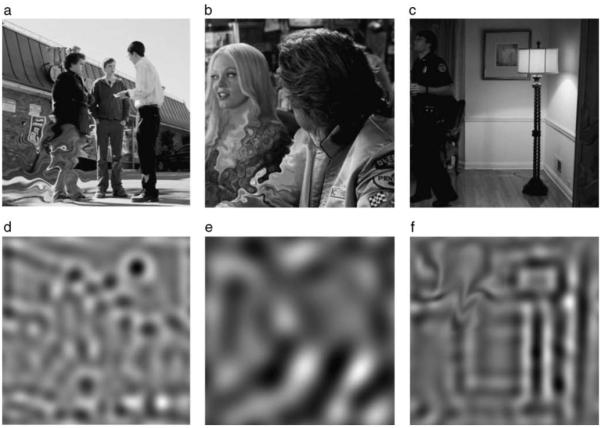
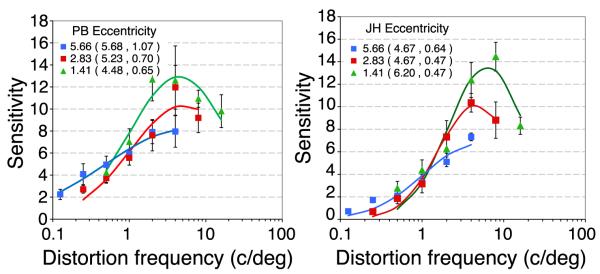
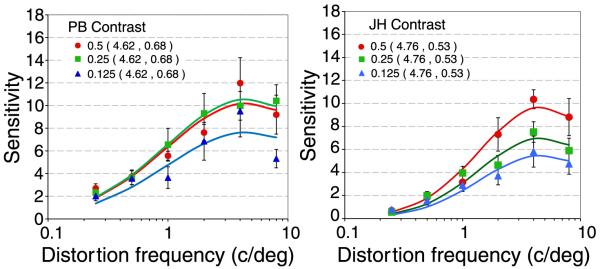
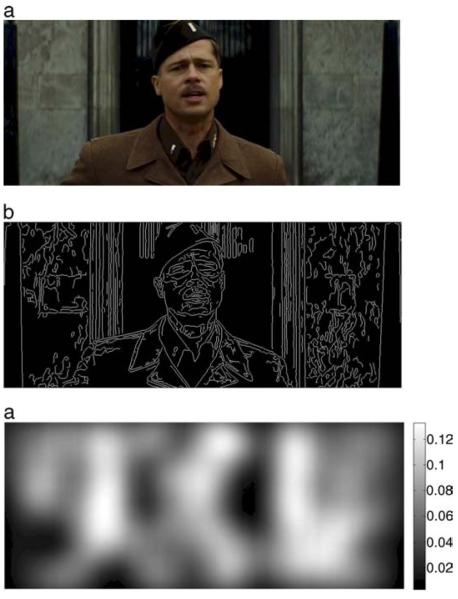
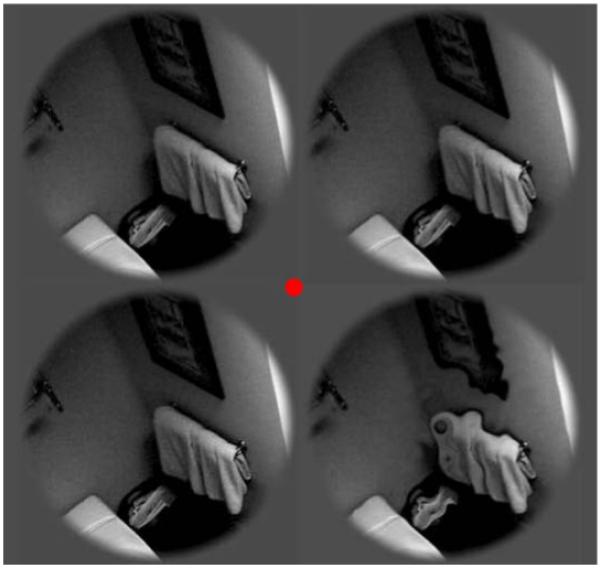
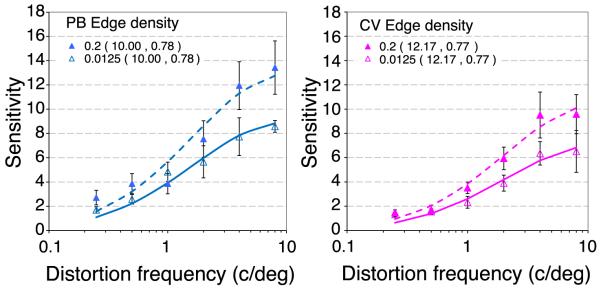
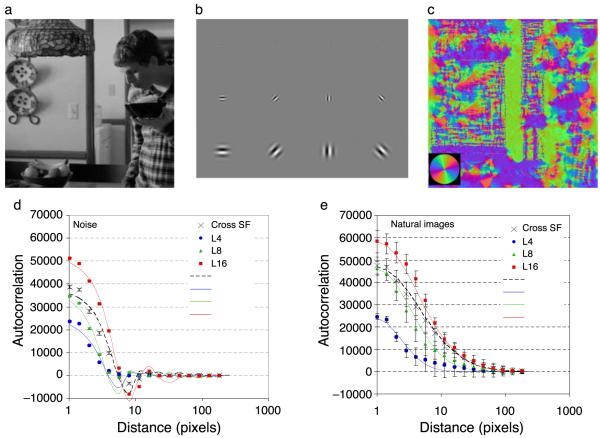
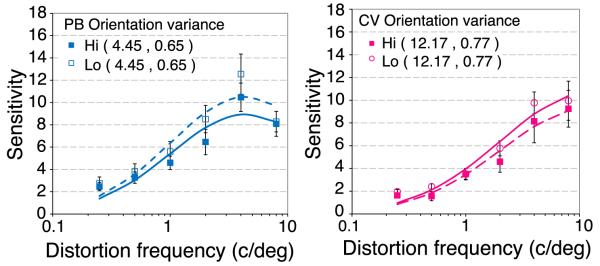
The perception of object structure in the natural environment is remarkably stable under large variation in image size and projection, especially given our insensitivity to spatial position outside the fovea. Sensitivity to periodic spatial distortions that were introduced into one quadrant of gray-scale natural images was measured in a 4AFC task. Observers were able to detect the presence of distortions in unfamiliar images even though they did not significantly affect the amplitude spectrum. Sensitivity depended on the spatial period of the distortion and on the image structure at the location of the distortion. The results suggest that the detection of distortion involves decisions made in the late stages of image perception and is based on an expectation of the typical structure of natural scenes.


Figures

Figure 1
Figure 1
Illustration of Spatial Distortion at different frequencies in one of four quadrants around central fixation in (a–c) real or (d) phase randomized natural images. Distortion was modulated at (a, upper right quadrant) 4 cycles per image (cpi), (b, upper right) 8 cpi, (c, upper left) 16 cpi, or (d, lower left) 32 cpi. Distortions were smoothed within the quadrant with a Gaussian (σ = 1°). Even though these images are probably unfamiliar, the distortion can easily be detected.
Figure 2
Figure 2
Effects of Spatial Distortion on the amplitude spectrum of the image. (a) A natural image with a characteristic “1/F” amplitude spectrum (b, green circles and fit, slope, α = −1.45). Distortion at 16 cpi is clearly visible (c), but has limited effect on the amplitude spectrum (b, red squares and fit, α = −1.41). The mean slopes of 10,000 undistorted (green circles) and distorted (red squares) images at distortion frequencies from to 0.25 to 8 c/deg (1 to 32 cpi) show a small but systematic effect of distortion. Error bars show ±1 standard deviation.
Figure 3
Figure 3
Sensitivity for two observers (PB and JH) to spatial distortions in one quadrant of real (green circles) or phase-randomized natural images (black triangles). Distortion sensitivity is defined a the inverse of distortion threshold, which is the positional shift in degrees required for subjects to detect the presence of distortion on 75% trials in a 4AFC task. The x-axis shows the spatial period over which distortion was modulated (see Figure 1 for examples). Error bars show 95% confidence intervals. The curves show the best fitting log Gaussian with the parameters (mean, standard deviation) shown in the caption.
Figure 4
Figure 4
Illustration of band-pass filtering and spatial distortion. Distortions introduced into the lower left quadrant of (a,b) two typical natural images are easily noticed, but could not be detected in band-pass filtered versions of the distorted image (d,e) at any spatial frequency or distortion frequency tested. However, distortions that are introduced (upper left quadrant) after band-pass filtering (c,f) are easily detected from the presence of spatial frequency artifacts outside the pass-band of the band-pass filtered image.
Figure 5
Figure 5
Distortion MTFs at three retinal eccentricities for two observers (PB and JH). The center of spatial distortion was presented at 1.4° (green triangles), 2.8° (red squares, replotted from Figure 3) or 5.7° (blue squares) at viewing distance of 43 cm, 86 cm or 172 cm respectively. The rms contrast of all stimuli was 0.5. Error bars show 95% confidence intervals. The curves show the best fitting log Gaussian with the parameters (mean, standard deviation) shown in the caption.
Figure 6
Figure 6
Distortion MTFs at three image contrasts for two observers (PB and JH). The global rms contrast of the image (standard deviation of pixel values divided by the mean) was varied between 0.125 (blue triangles), 0.25((green squares) and 0.5, (red circles, reproduced from Figure 3). The center of spatial distortion was 2.8° from fixation. Error bars show 95% confidence intervals. The curves show the best fitting log Gaussian with the parameters (mean, standard deviation) shown in the caption.
Figure 7
Figure 7
Analysis of local structure in natural scenes. Natural scenes (a) were analyzed with a Canny edge detector to find (b) the location of edges. Edge maps were smoothed with a Gaussian (σx,y = 1°) to generate (c) an estimate of the edge density within the test window. The color bar indicates the number of edge pixels per image pixel. Distortion was centered on the location with the closest match to the required edge density, from 0.0125 to 0.2 edges per image pixel.
Figure 8
Figure 8
Illustration of 4AFC stimuli used in Experiments 4 and 5.
Figure 9
Figure 9
Distortion MTFs at low or high local edge densities for two observers (PB, blue, and CV, pink). Spatial distortions were centered on regions of low (0.0125 edges per pixel, filled squares) or high (0.2 edges per pixel, open circles) local edge density. The rms contrast was 0.5 and the images were centered 2.8° from fixation in a 4AFC paradigm (Figure 8). Error bars show 95% confidence intervals. The curves show the best fitting log Gaussian with the parameters (mean, standard deviation) shown in the caption.
Figure 10
Figure 10
Orientation Structure of Natural Scenes. Natural images (a) were convolved with (b) a bank of Gabor quadrature filter pairs (sine phase shown) at 3 spatial frequencies and 4 orientations. Filter responses were combined to estimate (c) the local orientation at any point in the image (color wheel inset shows key). Autocorrelation functions for orientation images of (d) noise (fit with sinc functions) or (e) real scenes (fit with Gaussian functions) show that estimates of local orientation are correlated across a distance that increases with the size of the Gabor filter whose wavelength (L) was 4 (blue circles), 8 (green triangles) or 16 (red squares) pixels. Crosses show autocorrelation for the orientation estimate combined across spatial frequencies. Error bars show standard deviations across 10,000 images, each 256 pixels square. The local correlation in noise images is entirely due to the spatial integration of the Gabor filters, the much greater correlation of orientation across space in natural images is caused by the presence of elongated contour structure in natural scenes.
Figure 11
Figure 11
Distortion MTFs in areas of low (open circles) or high (filled squares) local orientation variability for two observers (PB, blue, and CV, pink). The overall rms contrast was 0.25 and the images were centered 2.8° from fixation in a 4AFC paradigm with the same images (Figure 8). Error bars show 95% confidence intervals. The curves show the best fitting log Gaussian with the parameters (mean, standard deviation) shown in the caption.

Similar articles

Cited by

References

    1. Amsler M. L’examen qualitatif de la fonctionmaculaire. Ophthalmologica. 1947;114:248–261.
    1. Anderson ND, Habak C, Wilkinson F, Wilson HR. Evaluating shape after-effects with radial frequency patterns. Vision Research. 2007;47:298–308. PubMed. - PubMed
    1. Badcock DR. Phase- or energy-based face discrimination: Some problems. Journal of Experimental Psychology of Human Perception and Performance. 1990;16:217–220. - PubMed
    1. Balboa RM, Grzywacz NM. Occlusions and their relationship with the distribution of contrasts in natural images. Vision Research. 2000;40:2661–2669. PubMed. - PubMed
    1. Barrett BT, Pacey IE, Bradley A, Thibos LN, Morrill P. Nonveridical visual perception in human amblyopia. Investigative Ophthalmology and Visual Science. 2003;44:1555–1567. [PubMed] [Article] - PubMed

Publication types