Review
. 2010:39:91-110.
doi: 10.1146/annurev.biophys.093008.131207.

Actin dynamics: from nanoscale to microscale

Affiliations
Review

Actin dynamics: from nanoscale to microscale

Anders E Carlsson. Annu Rev Biophys. 2010.

Abstract

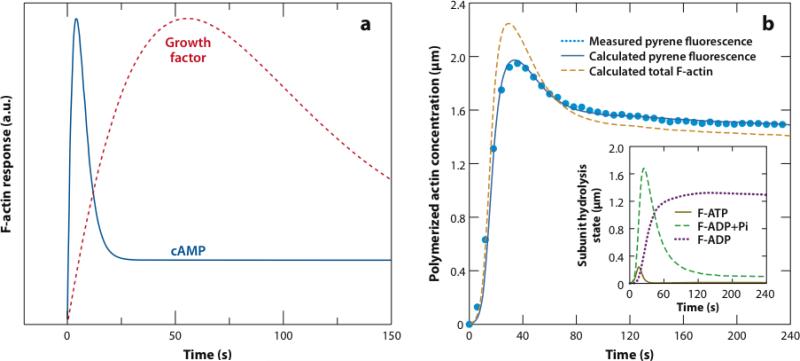
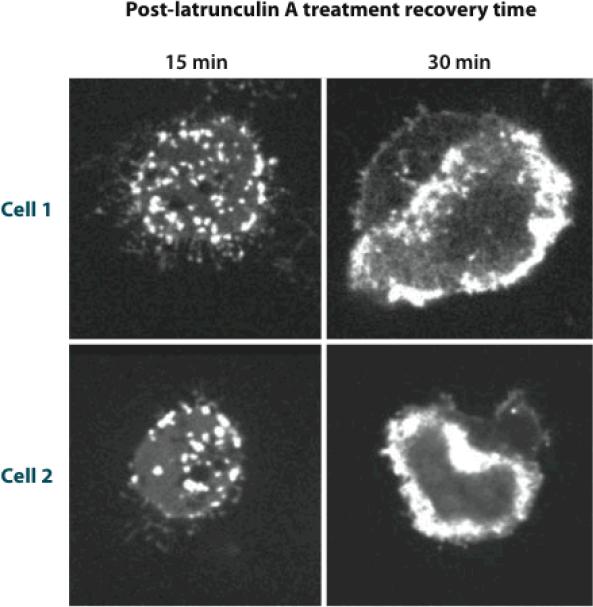
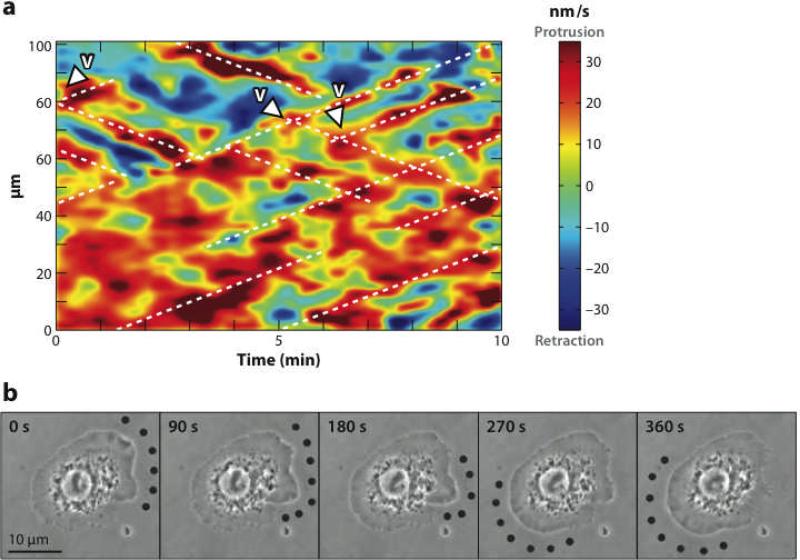
The dynamic nature of actin in cells manifests itself constantly. Polymerization near the cell edge is balanced by depolymerization in the interior, externally induced actin polymerization is followed by depolymerization, and spontaneous oscillations of actin at the cell periphery are frequently seen. I discuss how mathematical modeling relates quantitative measures of actin dynamics to the rates of underlying molecular level processes. The dynamic properties addressed include the rate of actin assembly at the leading edge of a moving cell, the disassembly rates of intracellular actin networks, the polymerization time course in externally stimulated cells, and spontaneous spatiotemporal patterns formed by actin. Although several aspects of actin assembly have been clarified by increasingly sophisticated models, our understanding of rapid actin disassembly is limited, and the origins of nonmonotonic features in externally stimulated actin polymerization remain unclear. Theory has generated several concrete, testable hypotheses for the origins of spontaneous actin waves and cell-edge oscillations. The development and use of more biomimetic systems applicable to the geometry of a cell will be key to obtaining a quantitative understanding of actin dynamics in cells.


Figures

Figure 1
Figure 1
(a) Structure of F-actin filament based on electron microscopy (34). Total length of filament is about 40 nm. (b) Branched network structure in keratocyte lamellipodium (66). Width of field in top frame is about 3 μm. Closeups are taken from indicated boxes in top frame.
Figure 2
Figure 2
Schematic of speckle microscopy. Membrane is at top. Solid blue circles denote areas with higher fluorescent labeling fraction. Open blue circles correspond to filled circles after they have moved away from the membrane. Bottom frame has lower labeling fraction, making the motion much easier to detect.
Figure 3
Figure 3
Theory (solid curves) versus experiment (dashed curves) for decay of F-actin (orange), cofilin (red), and tropomyosin (blue) densities away from leading edge of a keratocyte (35).
Figure 4
Figure 4
Schematic of external stimulation of actin polymerization in a cell. Solid blue circles denote external stimulant, such as epidermal growth factor. After stimulant attaces to cell membrane, an actin network grows (right).
Figure 5
Figure 5
(a) Schematic of actin polymerization in response to cAMP stimulation and growth factor stimulation. (b) Measured pyrene fluorescence (light blue dotted line) (67), calculated pyrene fluorescence (dark blue solid line), and calculated total F-actin (orange dashed line) versus time for rapidly polymerizing actin in vitro (10).
Figure 6
Figure 6
F-actin distribution in two Dictyostelium cells during recovery from latrunculin A treatment. (29).
Figure 7
Figure 7
(a) Patterns of protrusion in a PtK1epithelial cell. Color (red for protrusion and blue for retraction) indicates velocity of membrane motion. Vertical axis is the distance along the edge of the cell and horizontal axis is time. Diagonal lines demonstrate transverse motion of waves (45). (b) Transverse protrusion wave in fly wing-disk cell. Dots indicate region of protrusion. Scale bar is 10 μm (2).

References

    1. Alon U. An Introduction to Systems Biology: Design Principles of Biological Circuits. Chapman & Hall/CRC; Boca Raton, FL: 2007. pp. 41–73. Chapter 4: “The Feedforward Network Loop Motif”.
    1. Asano Y, Jimenez-Dalmaroni A, Liverpool TB, Marchetti MC, Giomi L, et al. Pak3 inhibits local actin filament formation to regulate global cell polarity. HFSP J. 2009;3:194–-203. - PMC - PubMed
    1. Atilgan E, Wirtz D, Sun SX. Mechanics and dynamics of actin-driven thin membrane protrusions. Biophys. J. 2006;90:65–-76. - PMC - PubMed
    1. Bernheim-Groswasser A, Prost J, Sykes C. Mechanism of actin-based motility: a dynamic state diagram. Biophys. J. 2005;89:1411–-19. - PMC - PubMed
    1. Betz T, Koch D, Lim D, Käs JA. Stochastic actin polymerization and steady retrograde flow determine growth cone advancement. Biophys. J. 2009;96:5130–-38. [5. Used a combination of microscopy and quantitative statistical analysis to establish strong correlations between cell-edge oscillations and actin polymerization] - PMC - PubMed

Publication types

LinkOut - more resources