. 2010;11(5):R51.
doi: 10.1186/gb-2010-11-5-r51. Epub 2010 May 12.

Nucleosome rotational setting is associated with transcriptional regulation in promoters of tissue-specific human genes

Affiliations

Nucleosome rotational setting is associated with transcriptional regulation in promoters of tissue-specific human genes

Charles Hebert et al. Genome Biol. 2010.

Abstract

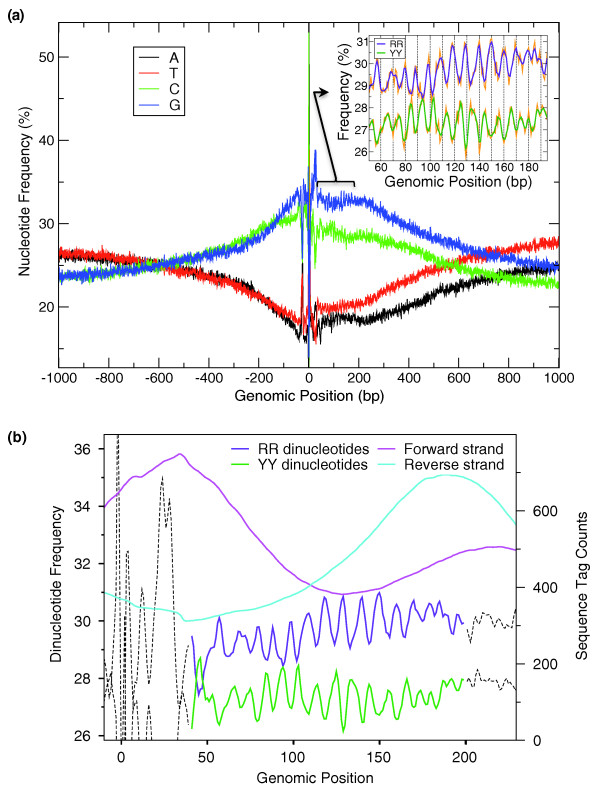
Background: The position of a nucleosome, both translational along the DNA molecule and rotational between the histone core and the DNA, is controlled by many factors, including the regular occurrence of specific dinucleotides with a period of approximately 10 bp, important for the rotational setting of the DNA around the histone octamer.

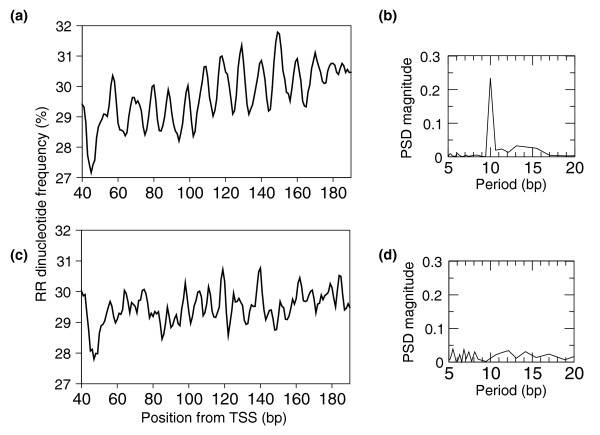
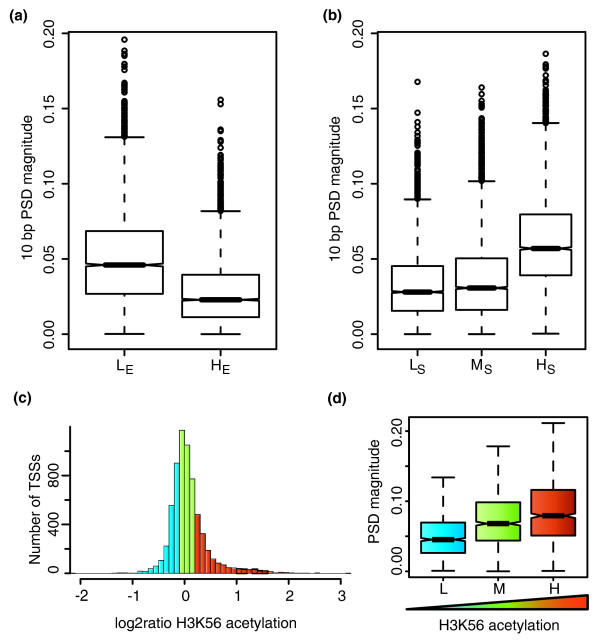
Results: We show that such a 10 bp periodic signal of purine-purine dinucleotides occurs in phase with the transcription start site (TSS) of human genes and is centered on the position of the first (+1) nucleosome downstream of the TSS. These data support a direct link between transcription and the rotational setting of the nucleosome. The periodic signal is most prevalent in genes that contain CpG islands that are expressed at low levels in a tissue-specific manner and are involved in the control of transcription.

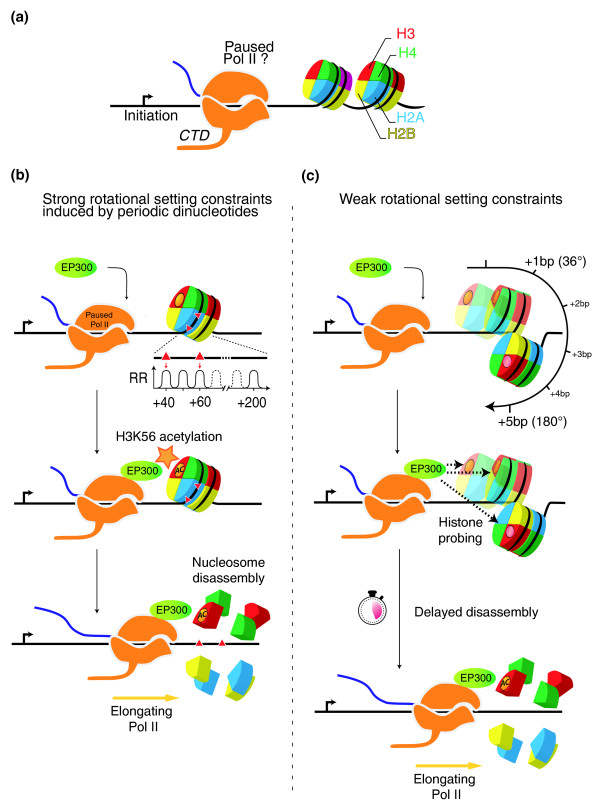
Conclusions: These results, together with several lines of evidence from the recent literature, support a new model whereby the +1 nucleosome could be more efficiently disassembled from gene promoters by H3K56 acetylation marks if the periodic signal specifies an optimal rotational setting.


Figures

Figure 1
Figure 1
A 10-bp periodic signal is present downstream of human transcription start sites. (a) Average compositional profiles around 13,622 human promoters. A 1,000-bp region on either side of each TSS was extracted from the genome and the 13,622 sequences were aligned at the TSS (base +1 is the first transcribed base). The average composition at each base-pair position is shown on the y-axis. Inset: average compositional profile of purine-purine and pyrimidine-pyrimidine dinucleotides between positions +40 and +200. The raw signal is shown in orange and a 3-bp smoothed distribution is shown in purple (RR) and dark green (YY). (b) DNA sequences of the +1 nucleosome contain the periodic signal. Sequence tags from nucleosome-bound DNA obtained by a ChIP-seq experiment [23] were remapped to the human genome and their density was smoothed with a sliding 70-bp window (see Materials and methods). Tags mapped to the forward (magenta) and the reverse (cyan) strand mark the 5' and 3' ends of nucleosome bound DNA fragments, respectively. Counter-phased RR (purple) and YY (green) dinucleotide frequencies, and base pair coordinates are as in (a).
Figure 2
Figure 2
CpG islands separate transcription start sites with and without the 10-bp RR periodic signal. (a, b) The 9,622 TSSs associated with a CpG island show a clear periodic signal (a) that translates into a strong and specific 10-bp periodic signal after DFT analysis (b). (c, d) In contrast, the 3,978 TSSs without CpG islands do not display an obvious periodic pattern (c), with no associated distinctive signal after DFT analysis (d).
Figure 3
Figure 3
The periodic signal varies with expression level and specificity, and H3K56 acetylation. (a) We divided 4,372 genes into two groups (low expression (LE) and high expression (HE)) according to their median expression level across 72 tissues. The boxplots show the distribution of the magnitude of the 10-bp periodic signal for 5,000 bootstrap iterations on 1,000 randomly selected TSSs in each group (see Materials and methods). The 10-bp periodic signal is stronger in the low expression group than in the high expression group. (b) The same set of genes were divided into three groups according to their tissue specificity (low, medium and high tissue specificity) and the same bootstrap analysis was performed. (c) The distribution of the normalized H3K56ac enrichment (log2 ratio) for the 6,518 TSSs that possess an H3K56ac sequence tag (see Materials and methods) is shown. The TSSs were divided into three groups of equal size with, respectively, low (L, blue) medium (M, green) and high (H, orange) H3K56ac enrichment ratios. (d) The three groups of H3K56ac enrichment are associated with different strengths of the periodic RR/YY signal. A randomization test shows that increased H3K56 acetylation levels is significantly correlated with increased 10-bp periodic signal (Wilcoxon rank sum test, one sided: L versus M P-value = 2.2 × 10⁻¹⁶; M versus H P-value = 3.8 × 10-07; L versus H P-value = 2.2 × 10⁻¹⁶).
Figure 4
Figure 4
Schematic representation of the spatial relationships between the nucleosome, the DNA molecule and RNA Pol II. (a) The nucleosome histone core (grey) is positioned on the DNA molecule (blue) with the first three minor groove-histone contact points containing RR dinucleotides (red). The RNA Pol II complex (gold) is shown here without its associated co-factors for clarity. (b) The same as in (a) but a side view, showing the RR dinucleotide in intimate contact with the histones. (c) If the nucleosome is shifted 5 bases closer to the RNA Pol II, it must rotate in space by 5 × 36° = 180° around the helical axis with respect to RNA pol II in order to preserve the contacts between the histones and the minor groove. (d) The same as in (c) but a side view, showing how the RR dinucleotides are now facing outwards and how the RNA Pol II 'sees' the first nucleosome from an entirely different angle.
Figure 5
Figure 5
A theoretical model of how the rotational setting of a nucleosome may facilitate its own disassembly by EP300 acetylation. (a) RNA pol II (Pol II) after transcription initiation at the TSS (black arrow). Our model is consistent with Pol II that is paused at this stage, although this is not a requirement. (b, c) Subsequent steps leading to elongation if the nucleosome is rotationally constrained (b), and the process for fuzzier nucleosome positioning (c). In (b), red triangles indicate the positions of two RR dinucleotides at a distance multiple of 10 bp from the TSS. Several hundred promoters carrying such a signal in the human genome would generate the pattern shown in Figure 2a. On a given sequence, this may be sufficient to constrain the +1 nucleosome to remain set at a specific position and thus at a specific rotational angle with respect to the advancing Pol II. After binding to its DNA recognition site and/or being recruited by other proteins, EP300 binds to Pol II and is now optimally located in space to deposit acetylation marks on the +1 nucleosome. These may include several targets on histone tails but critically includes H3K56 located on the globular part of H3 (orange circle), required for tipping the nucleosome assembly/disassembly equilibrium towards disassembly. Next, Pol II is free to engage in the elongation phase. In (c), RR dinucleotides occur randomly in the sequence and the +1 nucleosome may therefore adopt any rotational angle. Shown here are three possible nucleosome locations (+0, +1 and +5 bp from the position shown in (b)), each with a different angle. For instance, a 5-bp shift equivalent to half the helical pitch would rotate the nucleosome by approximately 180° with reference to the position at +0 bp, as shown in Figure 4. Depending on the nucleosome angle, EP300 is not optimally located with respect to its target and needs to search or probe for its histone target, thus delaying H3K56 acetylation and subsequent nucleosome disassembly.

Similar articles

Cited by

References

    1. Woodcock CL. Chromatin architecture. Curr Opin Struct Biol. 2006;16:213–220. doi: 10.1016/j.sbi.2006.02.005. - DOI - PubMed
    1. Henikoff S. Nucleosome destabilization in the epigenetic regulation of gene expression. Nat Rev Genet. 2008;9:15–26. doi: 10.1038/nrg2206. - DOI - PubMed
    1. Jiang C, Pugh BF. Nucleosome positioning and gene regulation: advances through genomics. Nat Rev Genet. 2009;10:161–172. doi: 10.1038/nrg2522. - DOI - PMC - PubMed
    1. Albert I, Mavrich T, Tomsho L, Qi J, Zanton S, Schuster S, Pugh B. Translational and rotational settings of H2A.Z nucleosomes across the Saccharomyces cerevisiae genome. Nature. 2007;446:572–576. doi: 10.1038/nature05632. - DOI - PubMed
    1. Chung HR, Vingron M. Sequence-dependent nucleosome positioning. J Mol Biol. 2008;386:1411–1422. doi: 10.1016/j.jmb.2008.11.049. - DOI - PubMed

Publication types

MeSH terms

LinkOut - more resources