

Expression of human eukaryotic initiation factor 3f oscillates with cell cycle in A549 cells and is essential for cell viability
- PMID: 20462454
- PMCID: PMC2877012
- DOI: 10.1186/1747-1028-5-10
Expression of human eukaryotic initiation factor 3f oscillates with cell cycle in A549 cells and is essential for cell viability
Abstract
Background: Transcriptional and postranslational regulation of the cell cycle has been widely studied. However, there is scarce knowledge concerning translational control of this process. Several mammalian eukaryotic initiation factors (eIFs) seem to be implicated in controlling cell proliferation. In this work, we investigated if the human eIF3f expression and function is cell cycle related.
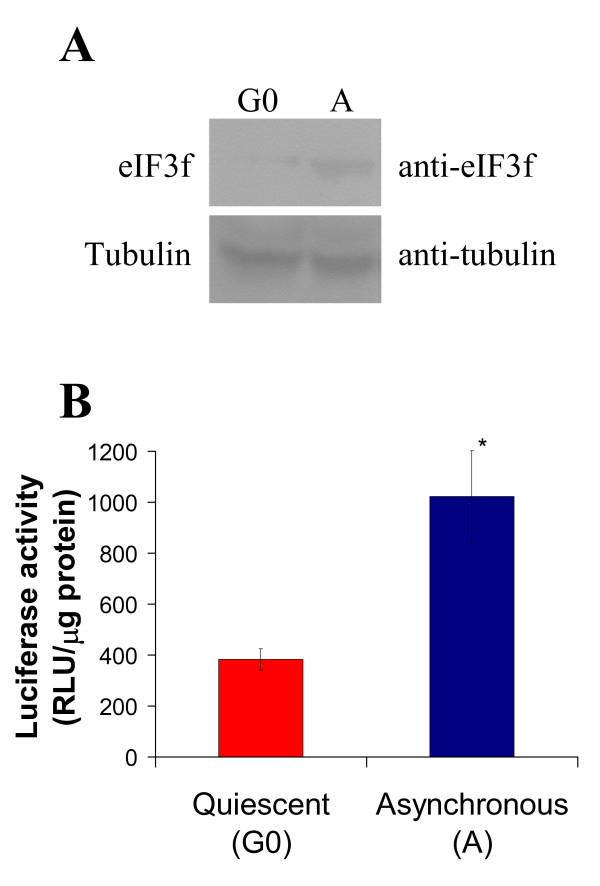
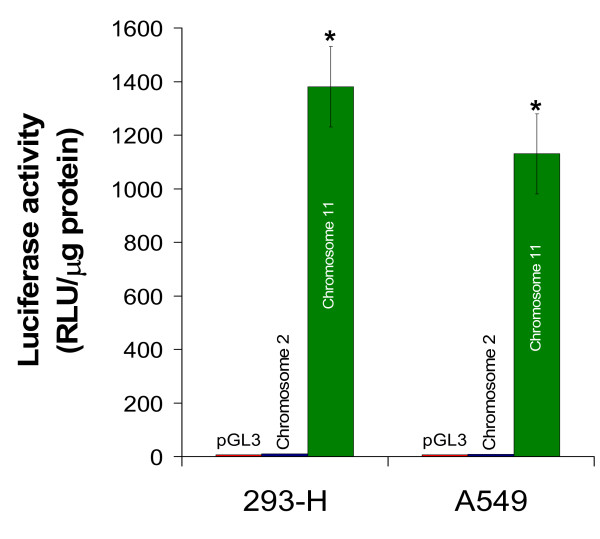
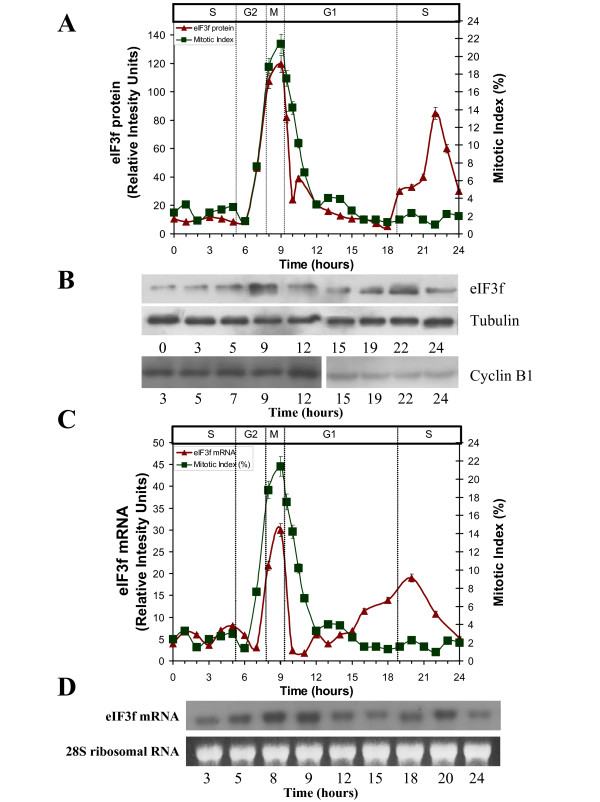
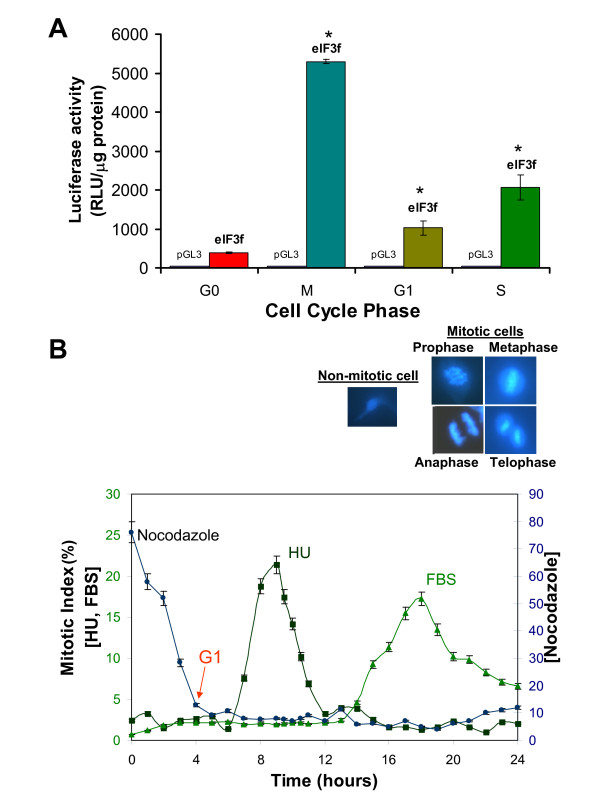
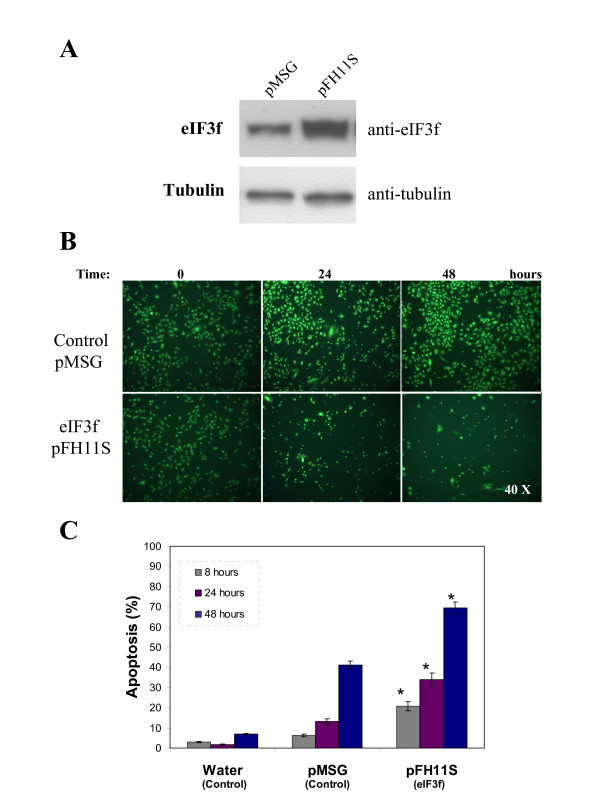
Results: The human eIF3f expression has been found to be upregulated in growth-stimulated A549 cells and downregulated in G0. Western blot analysis and eIF3f promotor-luciferase fusions revealed that eIF3f expression peaks twice in the cell cycle: in the S and the M phases. Deregulation of eIF3f expression negatively affects cell viability and induces apoptosis.
Conclusions: The expression pattern of human eIF3f during the cell cycle confirms that this gene is cell division related. The fact that eIF3f expression peaks in two cell cycle phases raises the possibility that this gene may exert a differential function in the S and M phases. Our results strongly suggest that eIF3f is essential for cell proliferation.
Figures

Similar articles
-
The eukaryotic translation initiation factor 3f (eIF3f) interacts physically with the alpha 1B-adrenergic receptor and stimulates adrenoceptor activity.BMC Biochem. 2015 Oct 23;16:25. doi: 10.1186/s12858-015-0054-5. BMC Biochem. 2015. PMID: 26497985 Free PMC article.
-
Decreased expression of eukaryotic initiation factor 3f deregulates translation and apoptosis in tumor cells.Oncogene. 2006 Aug 10;25(35):4923-36. doi: 10.1038/sj.onc.1209495. Epub 2006 Mar 13. Oncogene. 2006. PMID: 16532022
-
Loss of the eukaryotic initiation factor 3f in pancreatic cancer.Mol Carcinog. 2008 Mar;47(3):235-44. doi: 10.1002/mc.20379. Mol Carcinog. 2008. PMID: 17918192 Free PMC article.
-
Cell cycle-regulated and proliferation stimulus-responsive genes.Crit Rev Eukaryot Gene Expr. 1991;1(4):247-300. Crit Rev Eukaryot Gene Expr. 1991. PMID: 1802111 Review.
-
Initiation factor eIF3 and regulation of mRNA translation, cell growth, and cancer.Crit Rev Oncol Hematol. 2006 Sep;59(3):169-80. doi: 10.1016/j.critrevonc.2006.03.005. Epub 2006 Jul 7. Crit Rev Oncol Hematol. 2006. PMID: 16829125 Review.
Cited by
-
eIF3 interacts with histone H4 messenger RNA to regulate its translation.J Biol Chem. 2021 Jan-Jun;296:100578. doi: 10.1016/j.jbc.2021.100578. Epub 2021 Mar 23. J Biol Chem. 2021. PMID: 33766559 Free PMC article.
-
On the gain of entrainment in the n-dimensional ribosome flow model.J R Soc Interface. 2023 Feb;20(199):20220763. doi: 10.1098/rsif.2022.0763. Epub 2023 Feb 8. J R Soc Interface. 2023. PMID: 36751928 Free PMC article.
-
Large-scale mRNA translation and the intricate effects of competition for the finite pool of ribosomes.J R Soc Interface. 2022 Mar;19(188):20220033. doi: 10.1098/rsif.2022.0033. Epub 2022 Mar 9. J R Soc Interface. 2022. PMID: 35259953 Free PMC article.
-
Decreased expression of eukaryotic initiation factor 3f is an adverse prognostic factor for stage I-III gastric cancer.World J Surg Oncol. 2014 Mar 28;12:72. doi: 10.1186/1477-7819-12-72. World J Surg Oncol. 2014. PMID: 24678890 Free PMC article.
-
The eukaryotic translation initiation factor 3f (eIF3f) interacts physically with the alpha 1B-adrenergic receptor and stimulates adrenoceptor activity.BMC Biochem. 2015 Oct 23;16:25. doi: 10.1186/s12858-015-0054-5. BMC Biochem. 2015. PMID: 26497985 Free PMC article.
References
-
- Benne R, Hershey JW. The mechanism of action of protein synthesis initiation factors from rabbit reticulocytes. Biol Chem. 1978;253:3078–3087. - PubMed
-
- Brown-Luedi ML, Meyer LJ, Milburn SC, Yau PM, Corbett S, Hershey JW. Protein synthesis initiation factors from human HeLa cells and rabbit reticulocytes are similar: comparison of protein structure, activities, and immunochemical properties. Biochemistry. 1982;21:4202–4206. doi: 10.1021/bi00261a002. - DOI - PubMed
-
- Sonenberg N, Hershey JWB. Translational Control of Gene Expression. 2. Cold Spring Harbor Laboratory Press: Cold Spring Harbor, NY; 2000. pp. 33–88.
-
- Burks EA, Bezerra PP, Le H, Gallie DR, Browning KS. Plant initiation factor 3 subunit composition resembles mammalian initiation factor 3 and has a novel subunit. Biol Chem. 2001;276:2122–2131. - PubMed
LinkOut - more resources
Full Text Sources
