. 2010 Sep;22(9):1317-29.
doi: 10.1016/j.cellsig.2010.04.009. Epub 2010 May 10.

Wnt1, FoxO3a, and NF-kappaB oversee microglial integrity and activation during oxidant stress

Affiliations

Wnt1, FoxO3a, and NF-kappaB oversee microglial integrity and activation during oxidant stress

Yan Chen Shang et al. Cell Signal. 2010 Sep.

Abstract

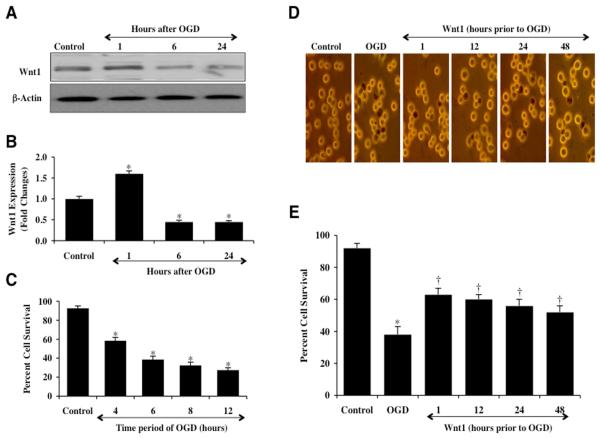
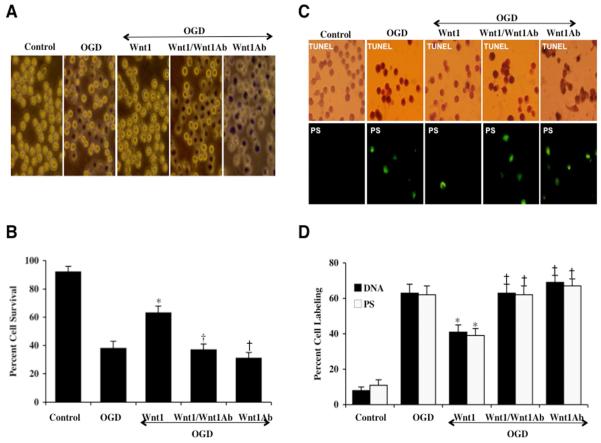
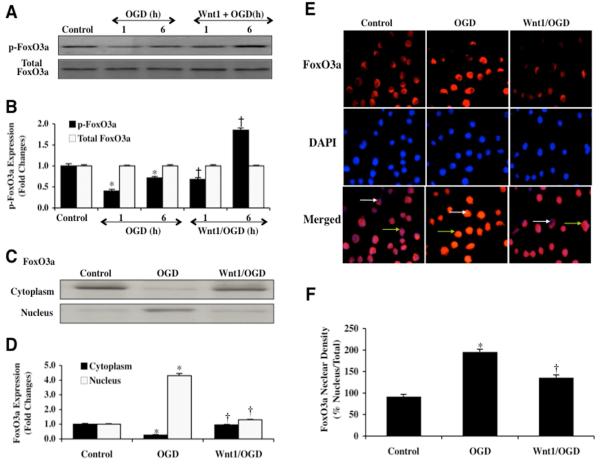
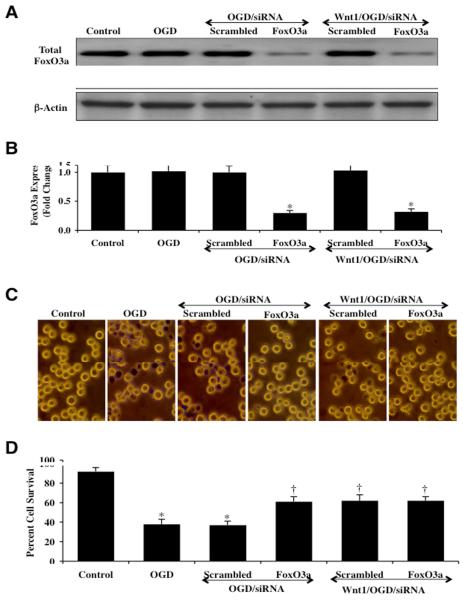
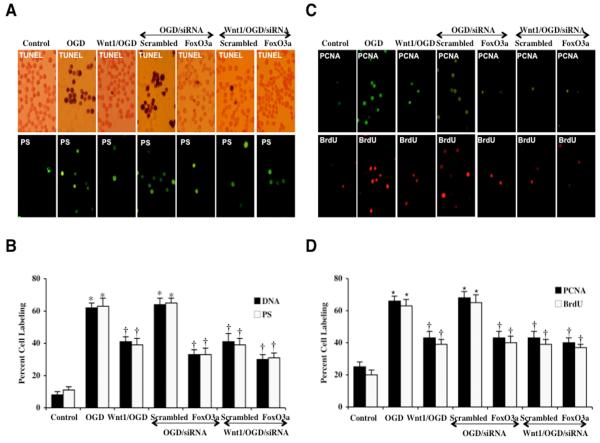
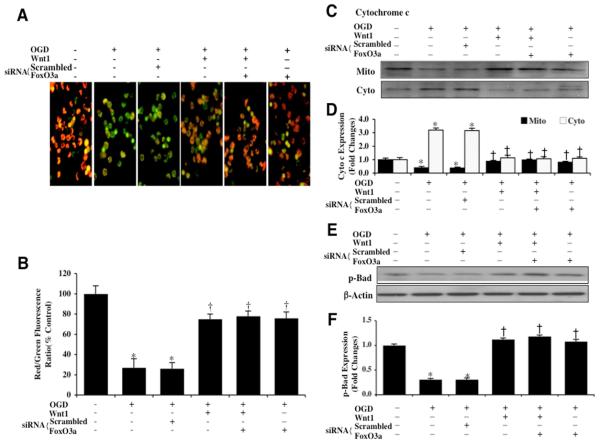
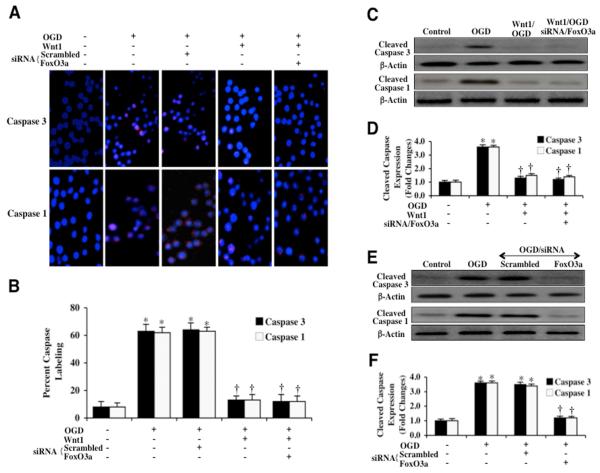
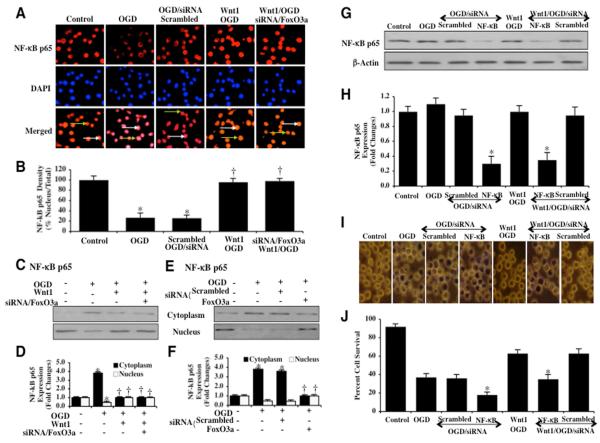
Elucidating the underlying mechanisms that govern microglial activation and survival is essential for the development of new treatment strategies for neurodegenerative disorders, since microglia serve not only as guardian sentries of the nervous system, but also play a significant role in determining neuronal and vascular cell fate. Here we show that endogenous and exogenous Wnt1 in inflammatory microglial cells is necessary for the prevention of apoptotic early membrane phosphatidylserine exposure and later DNA degradation, since blockade of Wnt1 signaling abrogates cell survival during oxidative stress. Wnt1 prevents apoptotic demise through the post-translational phosphorylation and maintenance of FoxO3a in the cytoplasm to inhibit an apoptotic cascade that relies upon the loss of mitochondrial membrane permeability, cytochrome c release, Bad phosphorylation, and activation of caspase 3 and caspase 1 as demonstrated by complimentary gene knockdown studies of FoxO3a. Furthermore, subcellular trafficking and gene knockdown studies of NF-kappaB p65 illustrate that microglial cell survival determined by Wnt1 during oxidative stress requires NF-kappaB p65. Our work highlights Wnt1 and the control of novel downstream transcriptional pathways as critical components for the oversight of nervous system microglial cells.


Figures

Fig. 1
Fig. 1. Exogenous Wnt1 is protective against OGD injury in microglia that blocks endogenous Wnt1 expression
(A and B) Microglial protein extracts (50 μg/lane) were immunoblotted with anti-Wnt1 (Wnt1) at 1, 6, and 24 hours following OGD exposure. Wnt1 expression is initially elevated at 1 hour, but then progressively and significantly is reduced at 6 and 24 hours following OGD exposure (*P<0.01 vs. control). (C) Microglia were exposed to progressive durations of OGD at 4, 6, 8, and 12 hours and microglial survival was determined 24 hours later by trypan blue dye exclusion assay. Microglial survival was significantly decreased to 58 ± 4% (4 hours), 38 ± 4% (6 hours), 32 ± 4% (8 hours), and 27 ± 3% (12 hours) following OGD exposure when compared with untreated control cultures (92 ± 3%, *P <0.01 vs. Control). Each data point represents the mean and SEM from 6 experiments. (D and E) Wnt1 (100 ng/ml) was administered 1, 12, 24, or 48 hours prior to a 6 hour period of OGD. Cell survival was determined 24 hours after OGD exposure through the trypan blue dye exclusion method. Representative images illustrate decreased trypan blue staining during Wnt1 application at each time period. Quantification of data demonstrates that OGD significantly decreased percent cell survival when compared to the control cells. Wnt1 significantly increased cell survival at each time period, but application of Wnt1 closest to the point of injury at the 1 hour period yielded the greatest degree of cytoprotection for microglia (*P<0.01 vs. control; †P<0.01 vs. OGD). Each data point represents the mean and SEM from 6 experiments. Control = untreated microglia.
Fig. 2
Fig. 2. Blockade of Wnt1 worsens microglial injury while application of exogenous Wnt1 prevents apoptotic early phosphatidylserine (PS) exposure and subsequent nuclear DNA degradation
(A and B) Microglial cells were exposed to a 6 hour period of OGD and microglial survival was determined 24 hours later by trypan blue assay. Representative images illustrate increased trypan blue staining during OGD and during blockade of Wnt1 with Wnt1Ab (1 μg/ml) and combined Wnt1 (100 ng/ml) administration. Wnt1 (100 ng/ml) administration alone significantly increased microglial survival during OGD. In addition, Wnt1Ab (1 μg/ml) alone markedly decreased microglial survival during OGD to a greater degree than OGD alone, suggesting that an endogenous level of Wnt1 in microglia is protective against cell injury. In all cases control = untreated microglia (*P<0.01 vs. OGD; †P <0.01 vs. Wnt1/OGD). Each data point represents the mean and SEM from 6 experiments. (C and D) Representative images illustrate that Wnt1 (100 ng/ml) administration during OGD significantly blocks microglial genomic DNA degradation assessed by TUNEL and membrane PS externalization assessed by annexin V phycoerythrin (green fluorescence). In contrast, blockade of Wnt1 with Wnt1Ab (1 μg/ml) resulted in increased DNA fragmentation and membrane PS exposure and higher apoptotic injury than OGD alone in the presence of Wnt1Ab (1 μg/ml) only, suggesting that an endogenous level of Wnt1 also provides protection against apoptotic early and late programs. Quantification of data illustrates that DNA fragmentation and membrane PS externalization were significantly increased following OGD for a 6 hour period when compared to untreated microglial control cultures, but Wnt1 (100 ng/ml) prevents DNA fragmentation and membrane PS exposure during OGD (*P<0.01 vs. OGD; †P <0.01 vs. Wnt1/OGD). Inhibition of Wnt1 with Wnt1Ab (1 μg/ml) significantly worsens apoptotic injury. Each data point represents the mean and SEM from 6 experiments.
Fig. 3
Fig. 3. Wnt1 maintains inhibitory phosphorylation of p-FoxO3a and prevents nuclear translocation of FoxO3a in microglia during OGD
In A and B, microglial protein extracts (50 μg/lane) were immunoblotted with anti-phosphorylated-FoxO3a (p-FoxO3a, Ser253) or anti-total FoxO3a at 1 and 6 hours following OGD exposure. Quantification of western band intensity was performed using the public domain NIH Image program (http://rsb.info.nih.gov/nih-image). During OGD, phosphorylated (inactive) FoxO3a (p-FoxO3a) expression is significantly decreased at 1 hour and 6 hours following OGD, but total FoxO3a expression not affected illustrating that FoxO3a protein is intact but post-translational phosphorylation has been changed (*P<0.01 vs. control). Wnt1 (100 ng/ml) administration increases phosphorylation of FoxO3a at 1 hour when compared to this time period with OGD only and significantly increases inhibitory phosphorylation of FoxO3a at 6 hours following OGD exposure (*P<0.01 vs. untreated microglia = Control; †P <0.01 vs. OGD at 1 hour). In C and D, equal amounts of cytoplasmic (cytoplasm) or nuclear (nucleus) protein extracts (50 μg/lane) were immunoblotted with anti-FoxO3a at 6 hours following administration of OGD. At 6 hours following OGD alone, FoxO3a translocates from the cytoplasm to the nucleus. In contrast, Wnt1 (100 ng/ml) prevents trafficking of FoxO3a from the cytoplasm to the cell nucleus in microglia (*P<0.01 vs. untreated microglia = Control; †P <0.01 vs. OGD). In E and F, microglia were imaged 6 hours following OGD with immunofluorescent staining for FoxO3a (Texas-red streptavidin). Nuclei of microglia were counterstained with DAPI. In merged images, untreated control microglia have visible nuclei (dark blue in color, white arrows) that illustrate absence of FoxO3a in the nucleus. Merged images after OGD demonstrate microglia with red cytoplasm (green arrows) and no visible nucleus with DAPI illustrating translocation of FoxO3a to the nucleus. Wnt1 (100 ng/ml) application during OGD maintains FoxO3a in the cytoplasm of microglia (*P<0.01 vs. untreated microglia = Control; †P <0.01 vs. OGD). In D and F, quantification of the intensity of FoxO3a nuclear staining or FoxO3a western expression was performed using the public domain NIH Image program (http://rsb.info.nih.gov/nih-image). Each data point represents the mean and SEM from 6 experiments.
Fig. 4
Fig. 4. Gene knockdown of FoxO3a increases microglial survival similar to Wnt1 during OGD
In A and B, microglial protein extracts (50 μ/lane) were immunoblotted with anti-total FoxO3a at 6 hours following OGD. Gene knockdown of FoxO3a was performed with transfection of FoxO3a siRNA (siRNA). FoxO3a siRNA significantly reduced expression of total FoxO3a following a 6 hour period of OGD or during Wnt1 (100 ng/ml) application with OGD, but non-specific scrambled siRNA did not alter total FoxO3a expression (*P<0.01 vs. OGD). Quantification of the western band intensity was performed using the public domain NIH Image program (http://rsb.info.nih.gov/nih-image). In C and D, gene knockdown of FoxO3a with FoxO3a siRNA (siRNA) significantly increased microglial survival and decreased microglial membrane injury assessed by trypan blue staining 24 hours after OGD in representative figures and quantitative analysis. In addition, significantly increased microglial cell survival is present during Wnt1 (100 ng/ml) administration with gene knockdown of FoxO3a similar to gene knockdown of FoxO3a alone during OGD. FoxO3a siRNA alone was not toxic and non-specific scrambled siRNA did not protect cells during OGD (*P<0.01 vs. untreated microglia = Control; †P <0.01 vs. OGD). Each data point represents the mean and SEM from 6 experiments.
Fig. 5
Fig. 5. Gene knockdown of FoxO3a prevents apoptotic DNA fragmentation and phosphatidylserine (PS) exposure through FoxO3a during OGD
In A, representative images illustrate gene knockdown of FoxO3a with FoxO3a siRNA (siRNA) significantly blocks microglial genomic DNA degradation assessed by TUNEL and membrane PS externalization assessed by annexin V phycoerythrin (green fluorescence) 24 hours after OGD. Non-specific scrambled siRNA did not alter DNA fragmentation or membrane PS exposure. In addition, combined administration of Wnt1 (100 ng/ml) during gene knockdown of FoxO3a also resulted in a similar degree of protection against DNA fragmentation and membrane PS exposure in microglia when compared to gene knockdown of FoxO3a alone, suggesting that Wnt1 requires FoxO3a inhibition for the prevention of apoptotic programs. In B, quantification of data illustrates that DNA fragmentation and membrane PS externalization were significantly increased following OGD when compared to untreated microglial control cultures, but transfection of FoxO3a siRNA alone or in combination with Wnt1 (100 ng/ml) prevents DNA fragmentation and membrane PS exposure during OGD (*P<0.01 vs. untreated microglia = Control; †P <0.01 vs. OGD). FoxO3a siRNA alone was not toxic and non-specific scrambled siRNA did not protect cells during OGD. Each data point represents the mean and SEM from 6 experiments. In C, representative images illustrate that PCNA and BrdU expression is significantly and rapidly increased in microglia at 6 hours after OGD. Wnt1 (100 ng/ml) alone or in combination with gene knockdown of FoxO3a with FoxO3a siRNA (siRNA) significantly decreases the expression of PCNA and the uptake of BrdU at 6 hours after OGD. In D, quantification of data demonstrates that PCNA and BrdU were significantly increased following OGD (*p<0.01 vs. untreated microglia = control). In addition, Wnt1 (100 ng/ml) alone or in combination with gene knockdown of FoxO3a with FoxO3a siRNA (siRNA) markedly reduces the expression of PCNA and the uptake of BrdU at 6 hours after OGD (*P<0.01 vs. untreated microglia = control; †P <0.01 vs. OGD). FoxO3a siRNA alone was not toxic and non-specific scrambled siRNA did not alter PCNA expression or BrdU uptake during OGD (†P <0.01 vs. OGD). In all cases, control = untreated cells. Each data point represents the mean and SEM from 6 experiments.
Fig. 6
Fig. 6. Wnt1 through FoxO3a prevents mitochondrial depolarization, blocks the release of cytochrome c, and maintains activation of Bad
In A, OGD leads to a significant decrease in the red/green fluorescence intensity ratio of mitochondria using the cationic membrane potential indicator JC-1 within 6 hours when compared with untreated control microglial cells, demonstrating that OGD leads to mitochondrial membrane depolarization. Application of Wnt1 (100 ng/ml) during OGD significantly increased the red/green fluorescence intensity of mitochondria in microglia, illustrating that mitochondrial membrane potential was restored. Furthermore, transfection of FoxO3a siRNA alone or in combination with Wnt1 (100 ng/ml) also maintained mitochondrial membrane potential similar to Wnt1 administration alone. Transfection with non-specific scrambled siRNA did not prevent mitochondrial membrane depolarization during OGD. In B, the relative ratio of red/green fluorescent intensity of mitochondrial staining in untreated control microglia, in microglia exposed to a 6 hour period of OGD, during Wnt1 administration or during Wnt1 administration with gene knockdown of FoxO3a, or during FoxO3a gene knockdown alone was measured in 6 independent experiments with analysis performed using the public domain NIH Image program (http://rsb.info.nih.gov/nih-image) (untreated microglia = Control vs. OGD, *P<0.01; Wnt1 or Wnt1 plus siRNA FoxO3a vs. OGD, †P<0.01). In C, equal amounts of mitochondrial (mito) or cytosol (cyto) protein extracts (50 μg/lane) were immunoblotted demonstrating that Wnt1 (100 ng/ml) administration alone, in combination with gene knockdown of FoxO3a, or gene knockdown of FoxO3a alone significantly prevented cytochrome c release from mitochondria 6 hours after OGD. Non-specific scrambled siRNA did not prevent cytochrome c release during OGD. In D, quantification of the western band intensity was performed using the public domain NIH image program (http://rsb.info.nih.gov/nih-image) and demonstrates that significant release of cytochrome c occurs 6 hours following OGD, but Wnt1 (100 ng/ml) administration alone or during Wnt1 administration with gene knockdown of FoxO3a prevents cytochrome c release from microglial mitochondria. Non-specific scrambled siRNA was ineffective during OGD to prevent cytochrome c release (untreated microglia = Control vs. OGD, *P<0.01; Wnt1 or Wnt1 plus siRNA FoxO3a vs. OGD, †P<0.01). Each data point represents the mean and SEM from 6 experiments. In E and F, primary microglial protein extracts (50 μ/lane) were immunoblotted with anti-phosphorylated-Bad (p-Bad, Ser136) at 6 hours following OGD. Phosphorylated Bad (p-Bad) expression is promoted by Wnt1 (100 ng/ml) administration alone, during Wnt1 administration with gene knockdown of FoxO3a, or during gene knockdown of FoxO3a alone, but is significantly diminished during OGD alone. Non-specific scrambled siRNA during OGD did not change Bad phosphorylation and was similar to Bad phosphorylation during OGD alone (untreated microglia = Control vs. OGD, *P<0.01; Wnt1 or Wnt1 plus siRNA FoxO3a vs. OGD, †P<0.01).
Fig. 7
Fig. 7. Wnt1 controls caspase 1 and caspase 3 during OGD that is dependent upon FoxO3a
In A, microglia were exposed to OGD and caspase 3 and caspase 1 activation were determined 6 hours after OGD period through immunocytochemistry with antibodies against cleaved active caspase 3 (17 kDa) and cleaved active caspase 1 (20 kDa). Representative images illustrate active caspase 3 staining or caspase 1 staining (red) in cells following OGD, but cellular red staining is almost absent during Wnt1 (100 ng/ml) administration alone or during Wnt1 administration with gene knockdown of FoxO3a. Non-specific scrambled siRNA did not eliminate caspase 3 or caspase 1 activity during OGD. In B, quantification of caspase 3 and caspase 1 immunocytochemistry was performed using the public domain NIH Image program (http://rsb.info.nih.gov/nih-image) and demonstrates that OGD significantly increased the expression of cleaved (active) caspase 3 or caspase 1 when compared to untreated control cells. Expression of cleaved (active) caspase 3 or caspase 1 was significantly limited during Wnt1 (100 ng/ml) administration alone or during Wnt1 administration with gene knockdown of FoxO3a. (*P <0.01 vs. untreated microglia = Control; †P<0.01 vs. OGD). In C, microglial protein extracts (50 μg/lane) were immunoblotted with anti-cleaved caspase 3 product (active caspase 3, 17 kDa) and with anti-cleaved caspase 1 product (active caspase 1, 20 kDa) at 6 hours following OGD. OGD markedly increased cleaved caspase 3 and caspase 1 expression, but Wnt1 (100 ng/ml) administration alone or during Wnt1 administration with gene knockdown of FoxO3a significantly blocked cleaved caspase 3 and caspase 1 expression 6 hours after OGD. Non-specific scrambled siRNA did not eliminate caspase 3 or caspase 1 activities during OGD. In D, quantification of western band intensity was performed using the public domain NIH Image program (http://rsb.info.nih.gov/nih-image) and demonstrates that Wnt1 (100 ng/ml) application alone or Wnt1 administration in combination with gene knockdown of FoxO3a prevents cleaved caspase 3 and caspase 1 expression 24 hours after OGD (*P <0.01 vs. untreated microglia = Control; †P<0.01 vs. OGD). Each data point represents the mean and SEM from 6 experiments. In E, microglial protein extracts (50 μg/lane) were immunoblotted with anti-cleaved caspase 3 product (active caspase 3, 17 kDa) and with anti-cleaved caspase 1 product (active caspase 1, 20 kDa) at 24 hours following OGD. OGD markedly increased cleaved caspase 3 and caspase 1 expression, but gene knockdown of FoxO3a with FoxO3a siRNA (siRNA) significantly blocks cleaved (active) caspase 3 and caspase 1 activities 24 hours after OGD. Non-specific scrambled siRNA did not eliminate caspase 3 or caspase 1 activities during OGD. In F, quantification of western band intensity was performed using the public domain NIH Image program (http://rsb.info.nih.gov/nih-image) and demonstrates that gene knockdown of FoxO3a prevents cleaved caspase 3 and caspase 1 expression 6 hours after OGD. In addition, non-specific scrambled siRNA did not change caspase 1 and caspase 3 activities when compared to OGD alone (*P <0.01 vs. untreated microglia = Control; †P<0.01 vs. OGD). Each data point represents the mean and SEM from 6 experiments.
Fig. 8
Fig. 8. Wnt1 promotes nuclear translocation of NF-κB that occurs with FoxO3a inhibition and relies upon NF-κB for cytoprotection
In A and B, microglia were imaged 6 hours following OGD with immunofluorescent staining for NF-κB p65 (Texas-red streptavidin). Nuclei of microglia were counterstained with DAPI. In merged images, untreated control microglia do not have visible nuclei (red in color, white arrows) that illustrate the presence of NF-κB p65 in the nucleus. Merged images after OGD demonstrate microglia with visible nuclei (light pink in color, white arrows) and red cytoplasm (green arrows) demonstrating that NF-κB p65 is retained in the cytoplasm. Wnt1 (100 ng/ml) administration during OGD or during Wnt1 administration with gene knockdown of FoxO3a during OGD fosters the translocation of NF-κB p65 to the cell nucleus. Non-specific scrambled siRNA does not alter NF-κB p65 subcellular trafficking during OGD (*P<0.01 vs. untreated microglia = Control; †P <0.01 vs. OGD). In C and D, equal amounts of cytoplasmic (cytoplasm) or nuclear (nucleus) protein extracts (50 μg/lane) were immunoblotted with anti- NF-κB p65 at 6 hours following administration of OGD. NF-κB p65 is maintained in the cytoplasm of microglia during OGD. In contrast, Wnt1 (100 ng/ml) administration with OGD or during Wnt1 administration with gene knockdown of FoxO3a with OGD allows trafficking of NF-κB p65 from the cytoplasm to the cell nucleus in microglia (*P<0.01 vs. untreated microglia = Control; †P <0.01 vs. OGD). In E and F, equal amounts of cytoplasmic (cytoplasm) or nuclear (nucleus) protein extracts (50 μg/lane) were immunoblotted with anti-NF-κB p65 at 6 hours following administration of OGD. As previously shown, NF-κB p65 is maintained in the cytoplasm of microglia during OGD. Yet, gene knockdown of FoxO3a during OGD fosters trafficking of NF-κB p65 from the cytoplasm to the cell nucleus in microglia. Non-specific scrambled siRNA did not alter NF-κB p65 translocation during OGD alone (*P<0.01 vs. untreated microglia = Control; †P <0.01 vs. OGD). In B, D, and F, quantification of the intensity of FoxO3a nuclear staining or NF-κB p65 expression on western was performed using the public domain NIH Image program (http://rsb.info.nih.gov/nih-image). Each data point represents the mean and SEM from 6 experiments. In G and H, microglial protein extracts (50 μ/lane) were immunoblotted with anti- NF-κB p65 at 6 hours following OGD. Gene knockdown of NF-κB p65 was performed with transfection of NF-κB p65 siRNA (siRNA). NF-κB p65 siRNA significantly reduced expression of NF-κB p65 following a 6 hour period of OGD or during Wnt1 (100 ng/ml) application with OGD, but non-specific scrambled siRNA did not alter NF-κB p65 expression (*P<0.01 vs. OGD). Quantification of the western band intensity was performed using the public domain NIH Image program (http://rsb.info.nih.gov/nih-image). In I and J, representative images and quantitative analysis show that gene knockdown of NF-κB p65 with NF-κB p65 siRNA (siRNA) significantly decreased microglial survival and increased microglial membrane injury assessed by trypan blue staining 24 hours after OGD. Loss of microglial cell survival also is present during Wnt1 (100 ng/ml) administration with gene knockdown of NF-κB p65 during OGD. In addition, gene knockdown of NF-κB during OGD alone resulted in increased cell injury when compared to microglial injury during OGD alone, illustrating that endogenous levels of NF-κB are cytoprotective during oxidative stress. Transfection with scrambled siRNA did not alter microglial injury during OGD or during OGD with Wnt1 (100 ng/ml) administration (*P<0.01 vs. OGD).

Similar articles

Cited by

References

    1. Chong ZZ, Li F, Maiese K. Int J Mol Med. 2007;19(2):263–72. - PMC - PubMed
    1. Madinier A, Bertrand N, Mossiat C, Prigent-Tessier A, Beley A, Marie C, Garnier P. PLoS ONE. 2009;4(12):e8101. - PMC - PubMed
    1. Salminen A, Kaarniranta K. J Mol Med. 2009;87(7):697–701. - PubMed
    1. Liang J, Takeuchi H, Jin S, Noda M, Li H, Doi Y, Kawanokuchi J, Sonobe Y, Mizuno T, Suzumura A. Brain Res. 2010;1322:8–23. - PubMed
    1. Maiese K, Chong ZZ, Hou J, Shang YC. Oxid Med Cell Longev. 2009;2(5):279–90. - PMC - PubMed

Publication types

MeSH terms