

A study of the precision and accuracy of peak quantification in comprehensive two-dimensional liquid chromatography in time
- PMID: 20462587
- PMCID: PMC2914511
- DOI: 10.1016/j.chroma.2010.04.039
A study of the precision and accuracy of peak quantification in comprehensive two-dimensional liquid chromatography in time
Abstract
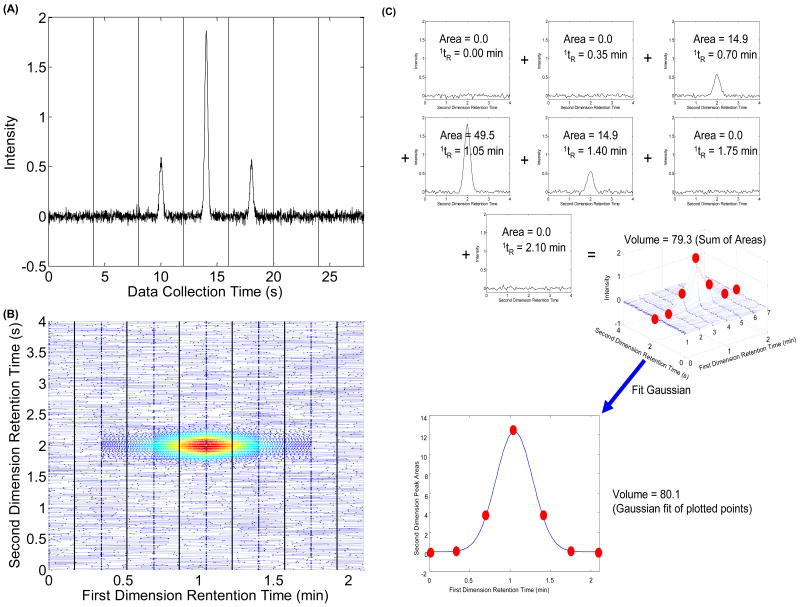
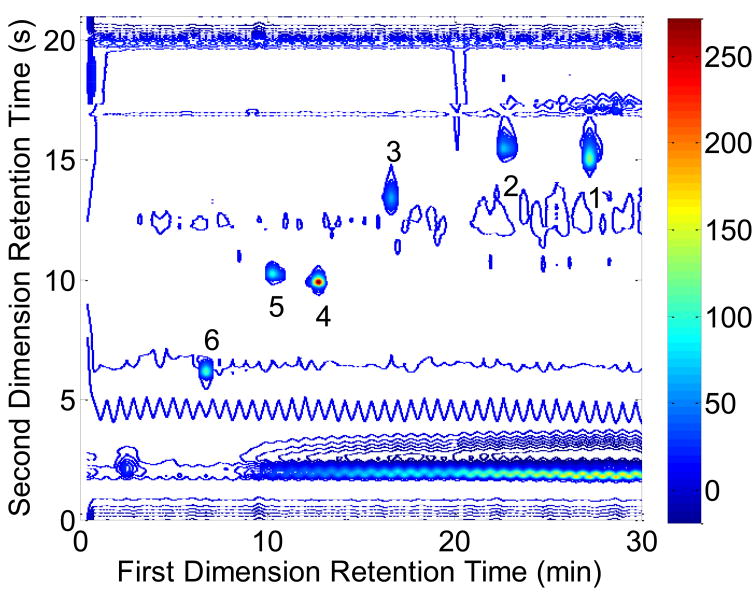
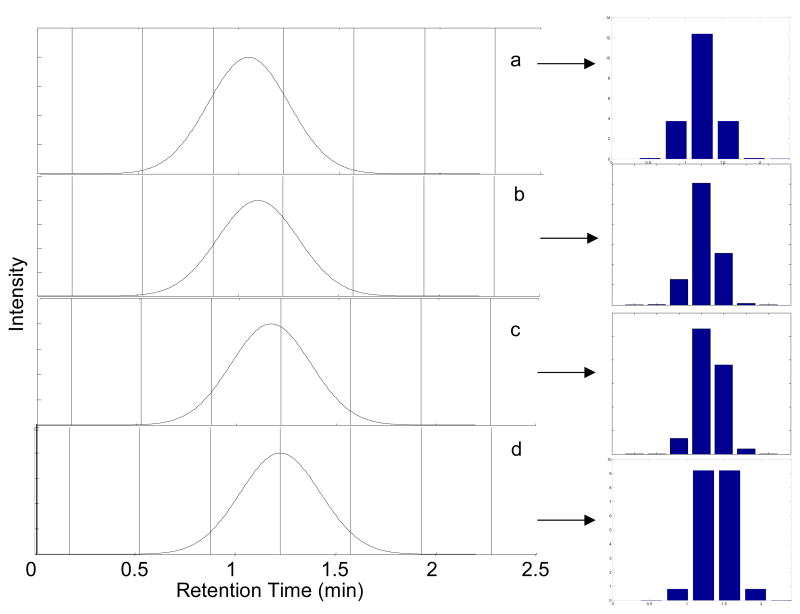
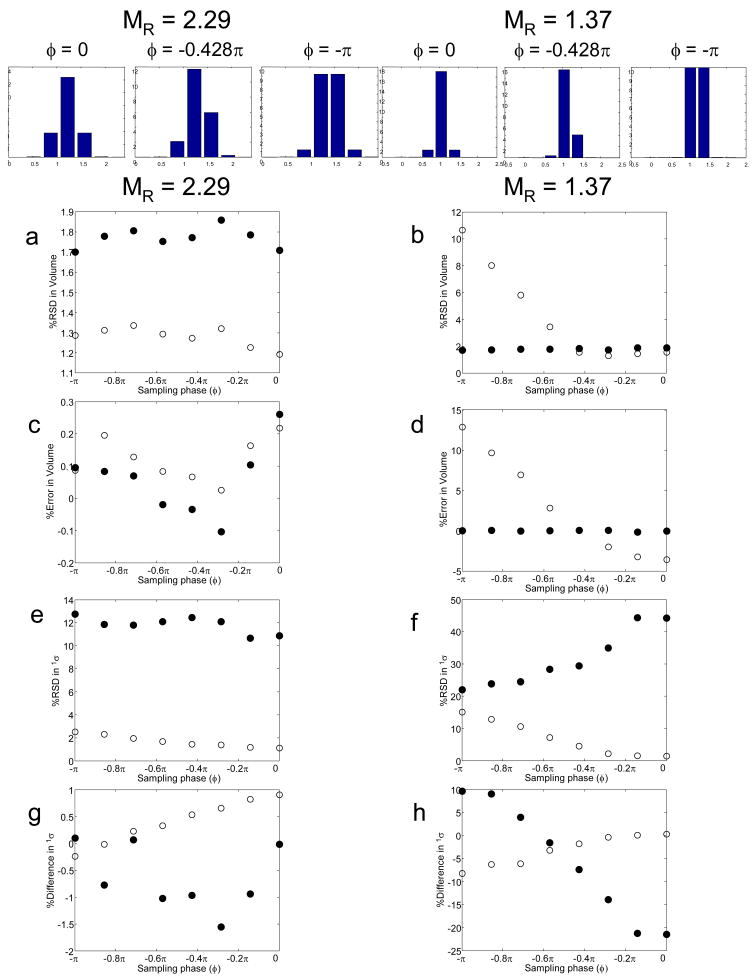
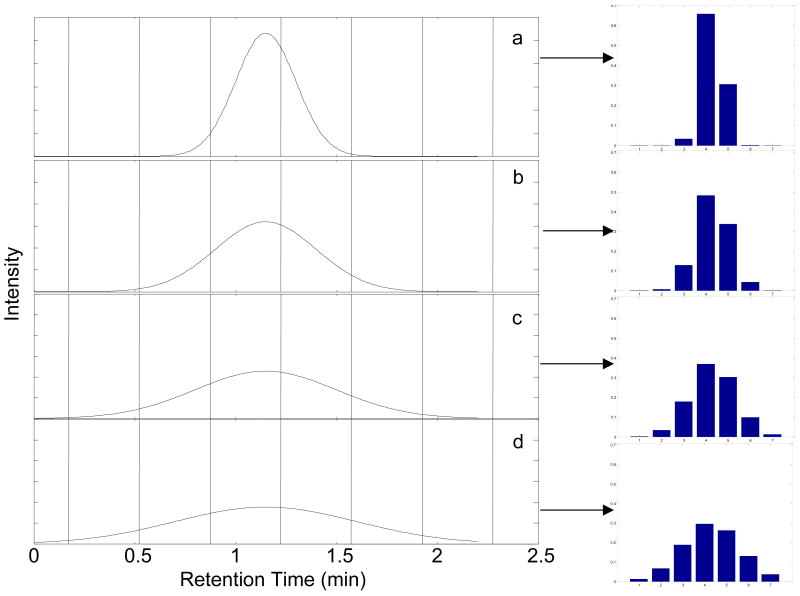
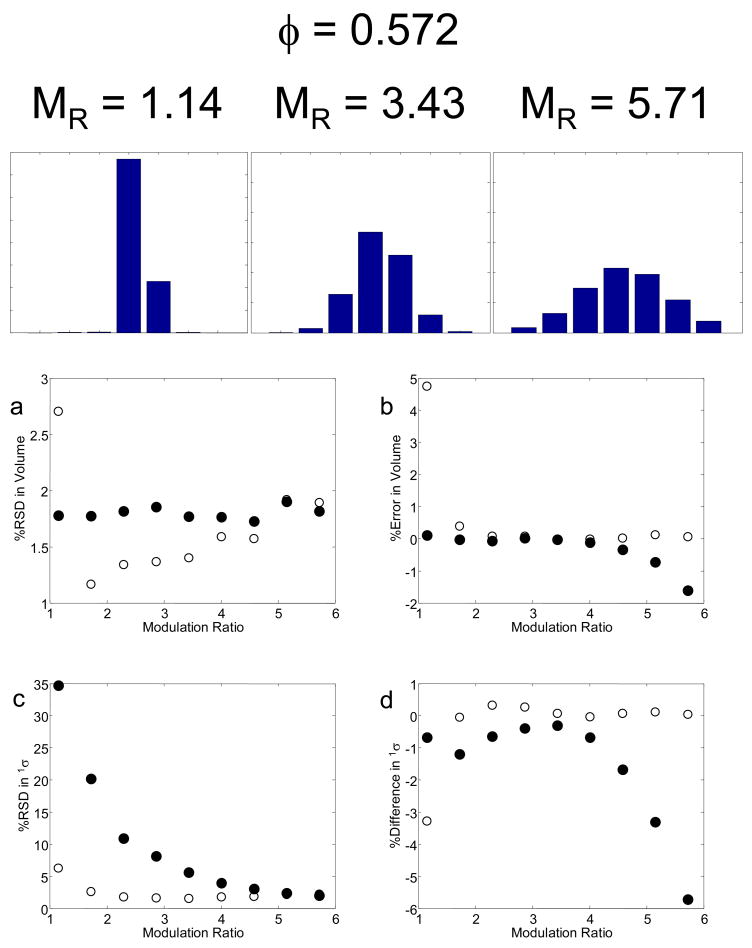
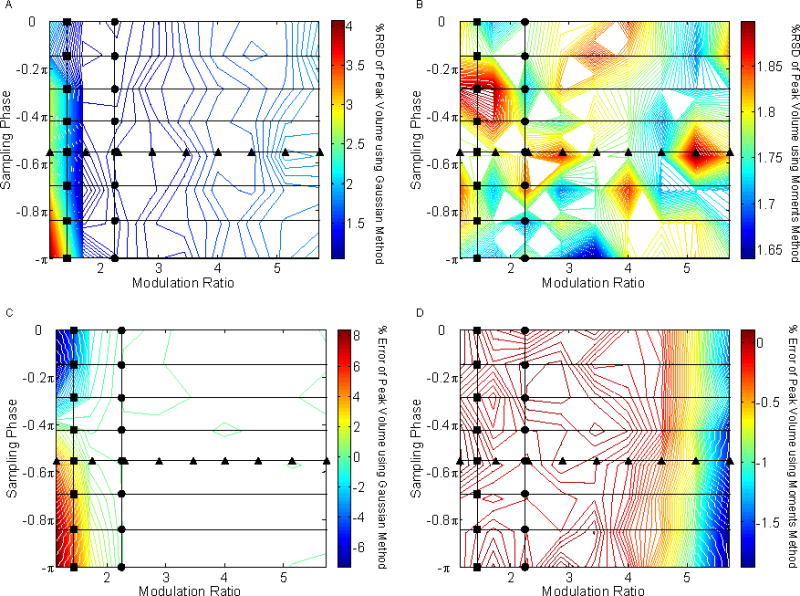
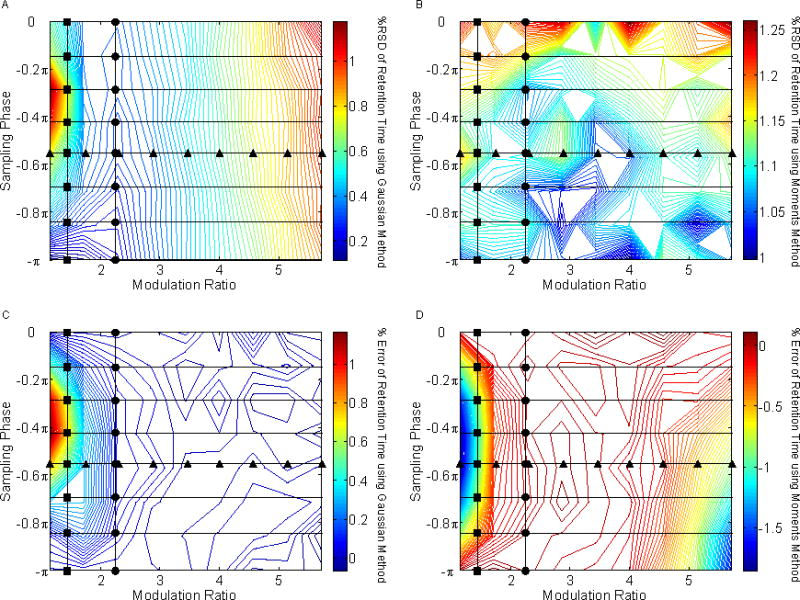
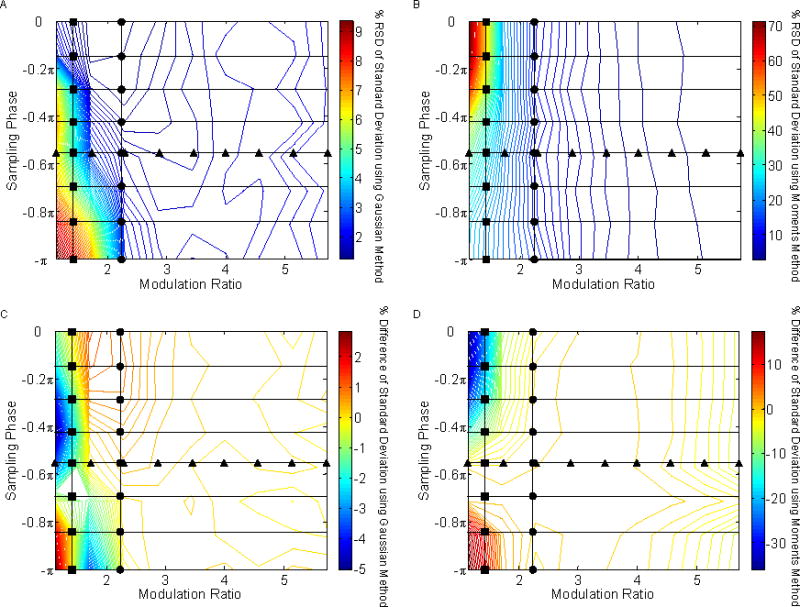
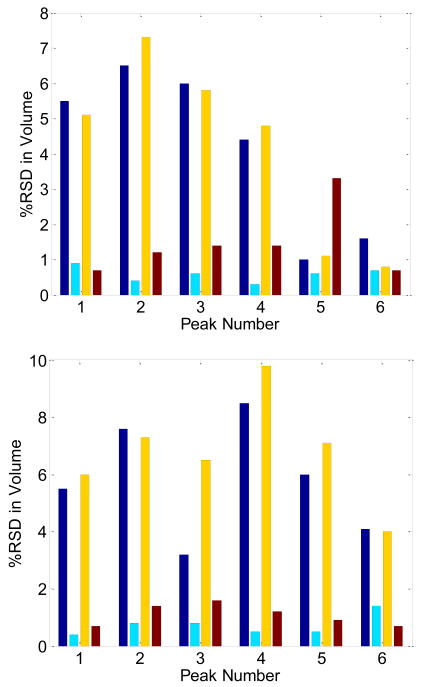
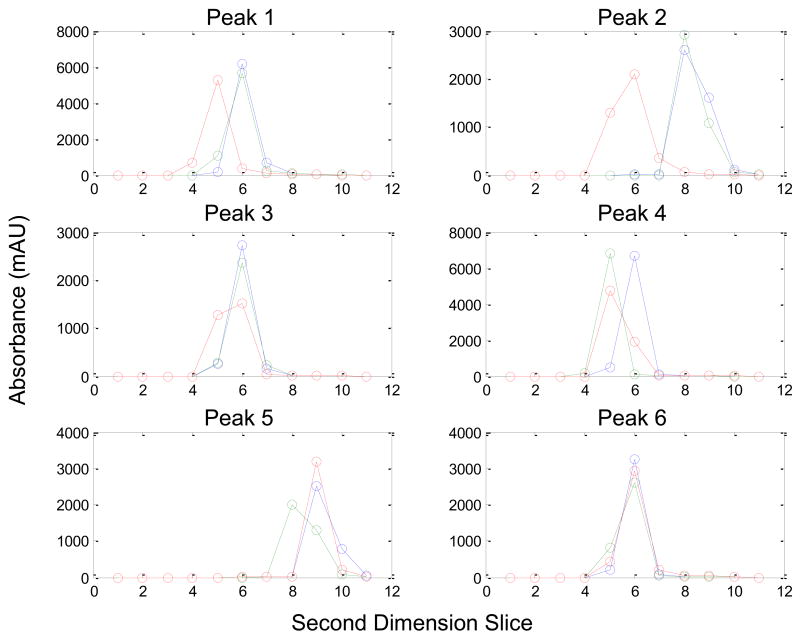
Simulated chromatographic data were used to determine the precision and accuracy in the estimation of peak volumes (i.e., peak sizes) in comprehensive two-dimensional liquid chromatography in time (LCxLC). Peak volumes were determined both by summing the areas in the second dimension chromatograms and by fitting the second dimension areas to a Gaussian peak. The Gaussian method is better at predicting the peak volume than the moments method provided there are at least three second dimension injections above the limit of detection (LOD). However, when only two of the second dimension signals are substantially above baseline, the accuracy and precision of the Gaussian fit method become quite poor because the results from the fitting algorithm become indeterminate. Based on simulations in which the modulation ratio (M(R)=4(1)sigma/t(s)) and sampling phase (phi) were varied, we conclude for well-resolved peaks that the optimum precision in peak volumes in 2D separations will be obtained when the M(R) is between two and five, such that there are typically four to ten second dimension peaks recorded over the eight sigma width of the first dimension peak. This sampling rate is similar to that suggested by the Murphy-Schure-Foley criterion. This provides an RSD of approximately 2% for the signal-to-noise ratio used in the present simulations. The precision of the peak volume of experimental data was also assessed, and RSD values were in the range of 4-5%. We conclude that the poorer precision found in the LCxLC experimental data as compared to LC may be due to experimental imprecision in sampling the effluent from the first dimension column.
Copyright 2010 Elsevier B.V. All rights reserved.
Figures
Similar articles
-
Two dimensional assisted liquid chromatography - a chemometric approach to improve accuracy and precision of quantitation in liquid chromatography using 2D separation, dual detectors, and multivariate curve resolution.Anal Chim Acta. 2015 Feb 15;859:87-95. doi: 10.1016/j.aca.2014.12.009. Epub 2014 Dec 10. Anal Chim Acta. 2015. PMID: 25622610
-
Likelihood of total resolution in liquid chromatography: evaluation of one-dimensional, comprehensive two-dimensional, and selective comprehensive two-dimensional liquid chromatography.J Chromatogr A. 2014 Sep 19;1360:128-42. doi: 10.1016/j.chroma.2014.07.066. Epub 2014 Jul 29. J Chromatogr A. 2014. PMID: 25108764
-
High resolution two-dimensional liquid chromatography coupled with mass spectrometry for robust and sensitive characterization of therapeutic antibodies at the peptide level.J Chromatogr B Analyt Technol Biomed Life Sci. 2019 Dec 15;1134-1135:121832. doi: 10.1016/j.jchromb.2019.121832. Epub 2019 Nov 12. J Chromatogr B Analyt Technol Biomed Life Sci. 2019. PMID: 31790917
-
Fast, comprehensive two-dimensional liquid chromatography.J Chromatogr A. 2007 Oct 19;1168(1-2):3-43; discussion 2. doi: 10.1016/j.chroma.2007.08.054. Epub 2007 Aug 30. J Chromatogr A. 2007. PMID: 17888443 Free PMC article. Review.
-
A review of two-dimensional liquid chromatography approaches using parallel column arrays in the second dimension.Anal Chim Acta. 2022 Oct 2;1228:340300. doi: 10.1016/j.aca.2022.340300. Epub 2022 Aug 26. Anal Chim Acta. 2022. PMID: 36127000 Review.
Cited by
-
Semi-automated alignment and quantification of peaks using parallel factor analysis for comprehensive two-dimensional liquid chromatography-diode array detector data sets.Anal Chim Acta. 2012 Apr 20;723:7-17. doi: 10.1016/j.aca.2012.02.019. Epub 2012 Feb 19. Anal Chim Acta. 2012. PMID: 22444567 Free PMC article.
-
Investigation of interpolation techniques for the reconstruction of the first dimension of comprehensive two-dimensional liquid chromatography-diode array detector data.Anal Chim Acta. 2011 Oct 31;705(1-2):253-60. doi: 10.1016/j.aca.2011.06.022. Epub 2011 Jun 23. Anal Chim Acta. 2011. PMID: 21962368 Free PMC article.
-
Chemometric Resolution and Quantification of Four-Way Data Arising from Comprehensive 2D-LC-DAD Analysis of Human Urine.Chemometr Intell Lab Syst. 2011 Mar 15;106(1):131-141. doi: 10.1016/j.chemolab.2010.07.008. Chemometr Intell Lab Syst. 2011. PMID: 24013363 Free PMC article.
References
Publication types
MeSH terms
Grants and funding
LinkOut - more resources
Full Text Sources
