

Evaluation of affinity microcolumns containing human serum albumin for rapid analysis of drug-protein binding
- PMID: 20462808
- PMCID: PMC2878846
- DOI: 10.1016/j.jchromb.2010.04.028
Evaluation of affinity microcolumns containing human serum albumin for rapid analysis of drug-protein binding
Abstract
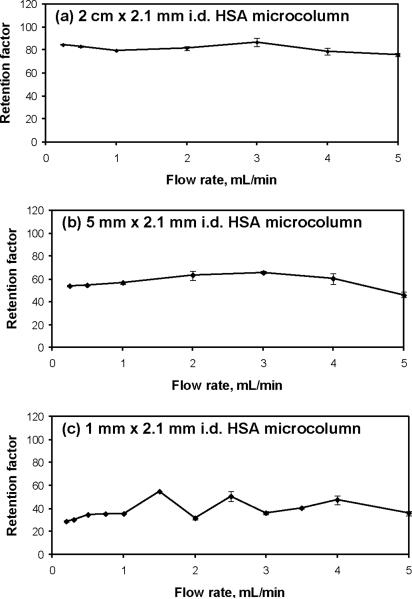
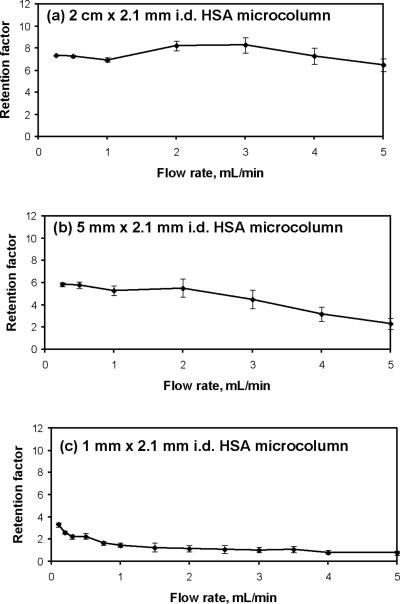
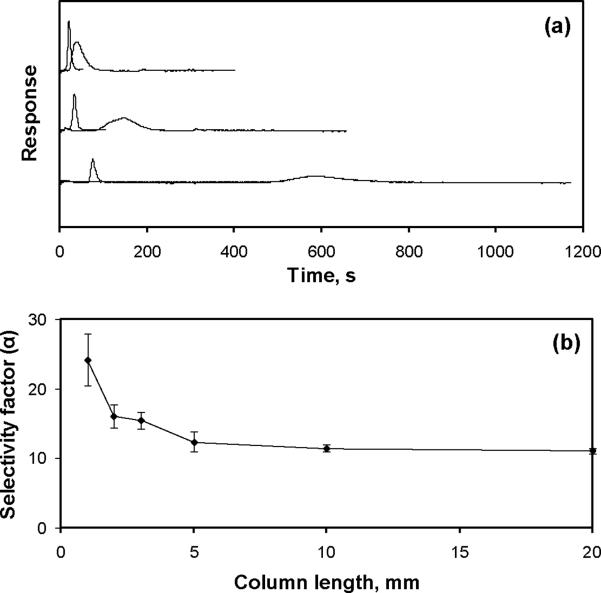
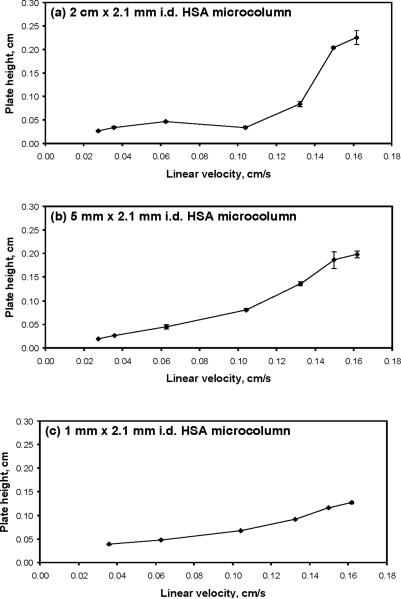
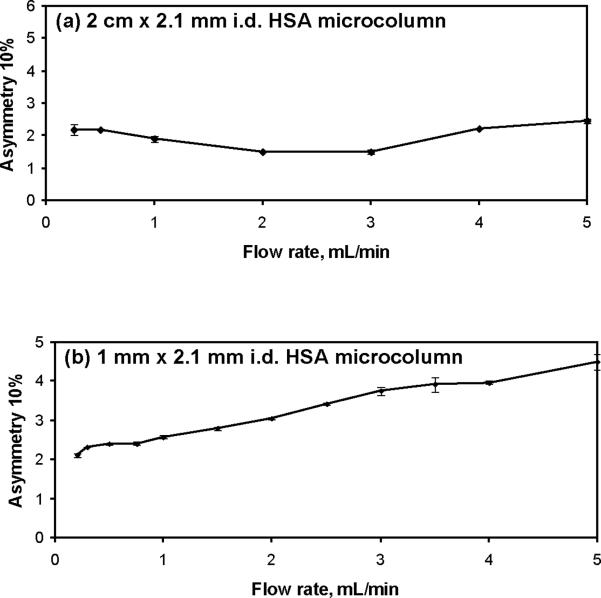
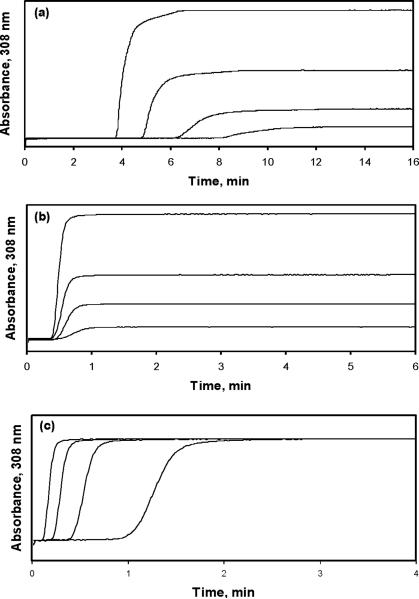
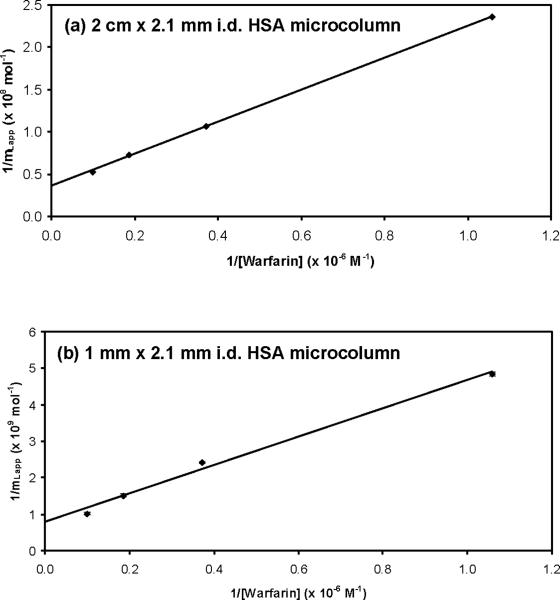
This study examined the use of affinity microcolumns as tools for the rapid analysis and high-throughput screening of drug-protein binding. The protein used was immobilized human serum albumin (HSA) and the model analytes were warfarin and L-tryptophan, two solutes often used as site-specific probes for drug binding to Sudlow sites I and II of HSA, respectively. The use of HSA microcolumns in binding studies was examined by using both zonal elution and frontal analysis formats. The zonal elution studies were conducted by injecting the probe compounds onto HSA microcolumns of varying lengths while measuring the resulting retention factors, plate heights and peak asymmetries. A decrease in the retention factor was noted when moving from longer to shorter column lengths while using a constant amount of injected solute. However, this change could be corrected, in part, by determining the relative retention factor of a solute versus a reference compound injected onto the same microcolumn. The plate height values were relatively consistent for all column lengths and gave an expected increase at higher linear velocities. The peak asymmetries were similar for all columns up to 1 mL/min but shifted to larger values at higher flow rates and when using short microcolumns (e.g., 1 mm length). The association equilibrium constants and number of binding sites estimated by frontal analysis for warfarin with HSA were consistent at the various column sizes that were tested and gave good agreement with previous literature values. These results confirmed affinity microcolumns provide comparable results to those obtained with longer columns and can be used in the rapid analysis of drug-protein binding and in the high-throughput screening of such interactions.
2010 Elsevier B.V. All rights reserved.
Figures
Similar articles
-
Analysis of drug-protein binding using on-line immunoextraction and high-performance affinity microcolumns: Studies with normal and glycated human serum albumin.J Chromatogr A. 2015 Oct 16;1416:112-20. doi: 10.1016/j.chroma.2015.09.023. Epub 2015 Sep 9. J Chromatogr A. 2015. PMID: 26381571 Free PMC article.
-
Analysis of drug-protein binding by ultrafast affinity chromatography using immobilized human serum albumin.J Chromatogr A. 2010 Apr 23;1217(17):2796-803. doi: 10.1016/j.chroma.2010.02.026. Epub 2010 Feb 23. J Chromatogr A. 2010. PMID: 20227701 Free PMC article.
-
Use of entrapment and high-performance affinity chromatography to compare the binding of drugs and site-specific probes with normal and glycated human serum albumin.Anal Bioanal Chem. 2013 Jul;405(17):5833-41. doi: 10.1007/s00216-013-6981-3. Epub 2013 May 9. Anal Bioanal Chem. 2013. PMID: 23657448 Free PMC article.
-
Analysis of biomolecular interactions using affinity microcolumns: a review.J Chromatogr B Analyt Technol Biomed Life Sci. 2014 Oct 1;968:49-63. doi: 10.1016/j.jchromb.2014.01.026. Epub 2014 Jan 27. J Chromatogr B Analyt Technol Biomed Life Sci. 2014. PMID: 24572459 Free PMC article. Review.
-
High-performance affinity chromatography and immobilized serum albumin as probes for drug- and hormone-protein binding.J Chromatogr B Biomed Sci Appl. 2000 Feb 28;739(1):39-54. doi: 10.1016/s0378-4347(99)00445-4. J Chromatogr B Biomed Sci Appl. 2000. PMID: 10744312 Review.
Cited by
-
Development of affinity microcolumns for drug-protein binding studies in personalized medicine: interactions of sulfonylurea drugs with in vivo glycated human serum albumin.Anal Chem. 2013 May 7;85(9):4453-60. doi: 10.1021/ac303734c. Epub 2013 Apr 17. Anal Chem. 2013. PMID: 23544441 Free PMC article.
-
Recent Advances in Supramolecular Affinity Separations: Affinity Chromatography and Related Methods.Adv Chromatogr. 2021;58:1-74. doi: 10.1201/9781003223405-1. Adv Chromatogr. 2021. PMID: 36186535 Free PMC article.
-
Kinetic Analysis by Affinity Chromatography.Front Chem. 2019 Oct 18;7:673. doi: 10.3389/fchem.2019.00673. eCollection 2019. Front Chem. 2019. PMID: 31681727 Free PMC article. Review.
-
Research in bioanalysis and separations at the University of Nebraska - Lincoln.Bioanalysis. 2011 May;3(10):1065-76. doi: 10.4155/bio.11.64. Bioanalysis. 2011. PMID: 21585300 Free PMC article.
-
Development of enhanced capacity affinity microcolumns by using a hybrid of protein cross-linking/modification and immobilization.J Chromatogr A. 2015 Jun 26;1400:82-90. doi: 10.1016/j.chroma.2015.04.051. Epub 2015 May 1. J Chromatogr A. 2015. PMID: 25981291 Free PMC article.
References
-
- Bertucci C, Domenici E. Curr. Med. Chem. 2002;9:1463. - PubMed
-
- Kragh-Hansen U. Pharmacol. Rev. 1981;33:17. - PubMed
-
- Otagiri M. Drug Metab. Pharmacokinet. 2005;20:309. - PubMed
-
- Peters T., Jr. All About Albumin: Biochemistry, Genetics, and Medical Applications. Academic Press; San Diego: 1996.
-
- Noctor TAG, Wainer IW. J. Chromatogr. 1992;577:305. - PubMed
Publication types
MeSH terms
Substances
Grants and funding
LinkOut - more resources
Full Text Sources
Medical
