

Frequency response of lift control in Drosophila
- PMID: 20462877
- PMCID: PMC2988251
- DOI: 10.1098/rsif.2010.0040
Frequency response of lift control in Drosophila
Abstract
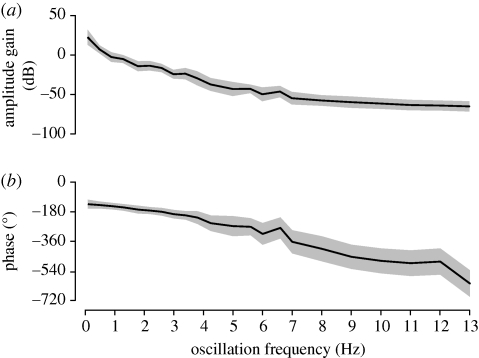
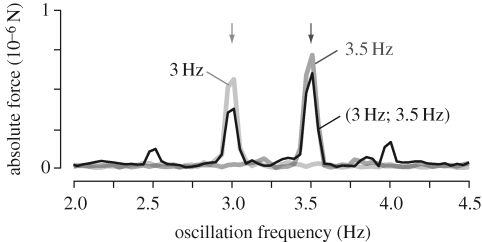
The flight control responses of the fruitfly represent a powerful model system to explore neuromotor control mechanisms, whose system level control properties can be suitably characterized with a frequency response analysis. We characterized the lift response dynamics of tethered flying Drosophila in presence of vertically oscillating visual patterns, whose oscillation frequency we varied between 0.1 and 13 Hz. We justified these measurements by showing that the amplitude gain and phase response is invariant to the pattern oscillation amplitude and spatial frequency within a broad dynamic range. We also showed that lift responses are largely linear and time invariant (LTI), a necessary condition for a meaningful analysis of frequency responses and a remarkable characteristic given its nonlinear constituents. The flies responded to increasing oscillation frequencies with a roughly linear decrease in response gain, which dropped to background noise levels at about 6 Hz. The phase lag decreased linearly, consistent with a constant reaction delay of 75 ms. Next, we estimated the free-flight response of the fly to generate a Bode diagram of the lift response. The limitation of lift control to frequencies below 6 Hz is explained with inertial body damping, which becomes dominant at higher frequencies. Our work provides the detailed background and techniques that allow optomotor lift responses of Drosophila to be measured with comparatively simple, affordable and commercially available techniques. The identification of an LTI, pattern velocity dependent, lift control strategy is relevant to the underlying motion computation mechanisms and serves a broader understanding of insects' flight control strategies. The relevance and potential pitfalls of applying system identification techniques in tethered preparations is discussed.
Figures
Similar articles
-
Visual control of flight speed in Drosophila melanogaster.J Exp Biol. 2009 Apr;212(Pt 8):1120-30. doi: 10.1242/jeb.020768. J Exp Biol. 2009. PMID: 19329746
-
Optomotor control of course and altitude in Drosophila melanogaster is correlated with distinct activities of at least three pairs of flight steering muscles.J Exp Biol. 1996 Aug;199(Pt 8):1711-26. doi: 10.1242/jeb.199.8.1711. J Exp Biol. 1996. PMID: 8708578
-
The free-flight response of Drosophila to motion of the visual environment.J Exp Biol. 2008 Jul;211(Pt 13):2026-45. doi: 10.1242/jeb.008268. J Exp Biol. 2008. PMID: 18552291
-
The mechanisms of lift enhancement in insect flight.Naturwissenschaften. 2004 Mar;91(3):101-22. doi: 10.1007/s00114-004-0502-3. Epub 2004 Mar 4. Naturwissenschaften. 2004. PMID: 15034660 Review.
-
Mechanics and aerodynamics of insect flight control.Biol Rev Camb Philos Soc. 2001 Nov;76(4):449-71. doi: 10.1017/s1464793101005759. Biol Rev Camb Philos Soc. 2001. PMID: 11762490 Review.
Cited by
-
Behavioural system identification of visual flight speed control in Drosophila melanogaster.J R Soc Interface. 2011 Feb 6;8(55):171-85. doi: 10.1098/rsif.2010.0225. Epub 2010 Jun 4. J R Soc Interface. 2011. PMID: 20525744 Free PMC article.
-
Controlling roll perturbations in fruit flies.J R Soc Interface. 2015 Apr 6;12(105):20150075. doi: 10.1098/rsif.2015.0075. J R Soc Interface. 2015. PMID: 25762650 Free PMC article.
-
Vision-based flight control in the hawkmoth Hyles lineata.J R Soc Interface. 2013 Dec 11;11(91):20130921. doi: 10.1098/rsif.2013.0921. Print 2014 Feb 6. J R Soc Interface. 2013. PMID: 24335557 Free PMC article.
-
Embodied linearity of speed control in Drosophila melanogaster.J R Soc Interface. 2012 Dec 7;9(77):3260-7. doi: 10.1098/rsif.2012.0527. Epub 2012 Aug 29. J R Soc Interface. 2012. PMID: 22933185 Free PMC article.
-
MEMS-Based Micro Sensors for Measuring the Tiny Forces Acting on Insects.Sensors (Basel). 2022 Oct 20;22(20):8018. doi: 10.3390/s22208018. Sensors (Basel). 2022. PMID: 36298366 Free PMC article. Review.
References
-
- Borst A., Bahde S. 1986. What kind of movement detector is triggering the landing response of the housefly? Biol. Cybernet. 55, 59–69. (10.1007/BF00363978) - DOI
-
- Borst A., Haag J. 2002. Neural networks in the cockpit of the fly. J. Comp. Physiol. A: Sensory, Neural, and Behavioral Physiology 188, 419–437. - PubMed
-
- Buchner E. 1984. Behavioral analysis of spatial vision in insects. In Photoreception and vision in invertebrates (ed. Ali M. A.), pp. 561–621. New York, NY: Plenum Press.
Publication types
MeSH terms
LinkOut - more resources
Full Text Sources
Molecular Biology Databases
