. 2010 Jul 1;21(13):2338-54.
doi: 10.1091/mbc.e10-01-0028. Epub 2010 May 12.

A G{alpha}i-GIV molecular complex binds epidermal growth factor receptor and determines whether cells migrate or proliferate

Affiliations

A G{alpha}i-GIV molecular complex binds epidermal growth factor receptor and determines whether cells migrate or proliferate

Pradipta Ghosh et al. Mol Biol Cell. .

Abstract

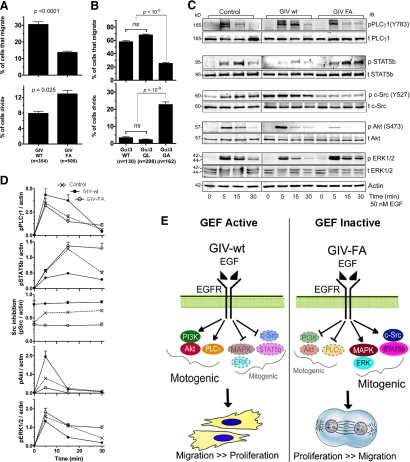
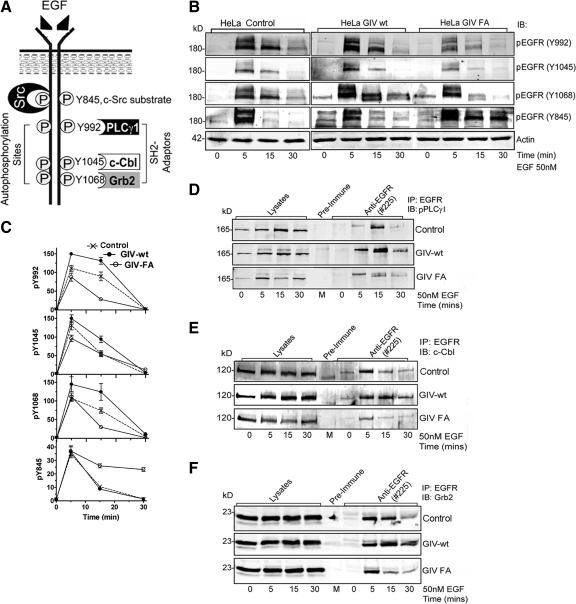
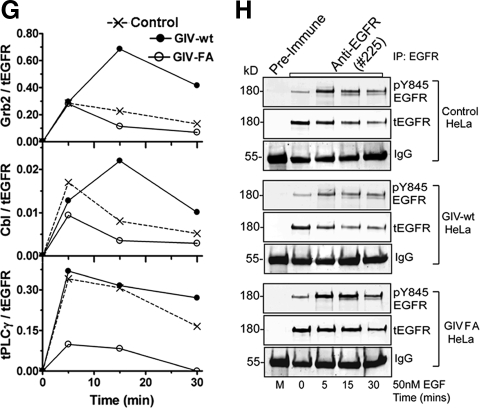
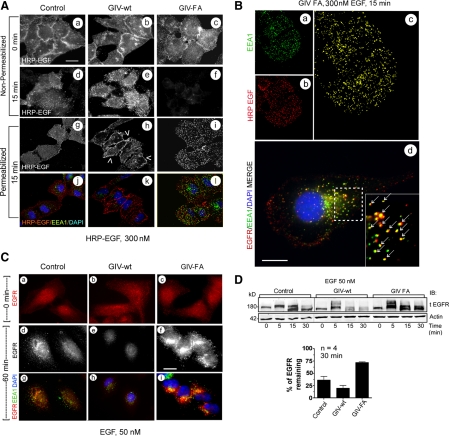
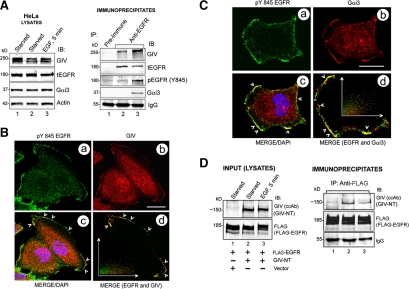
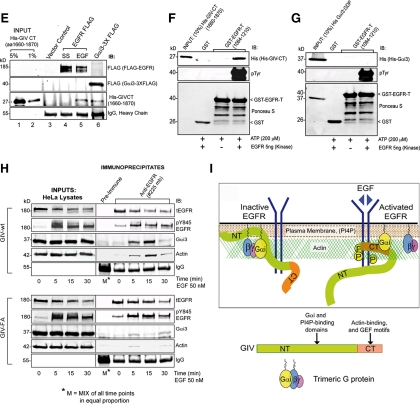
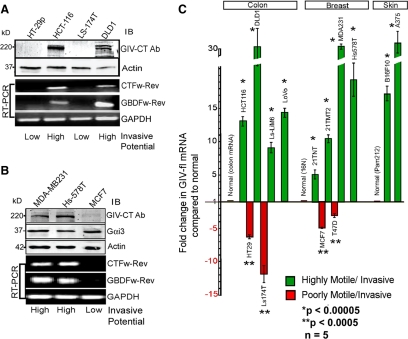
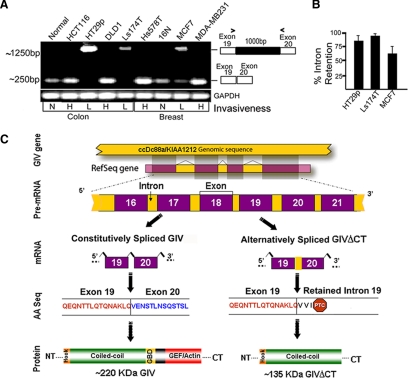
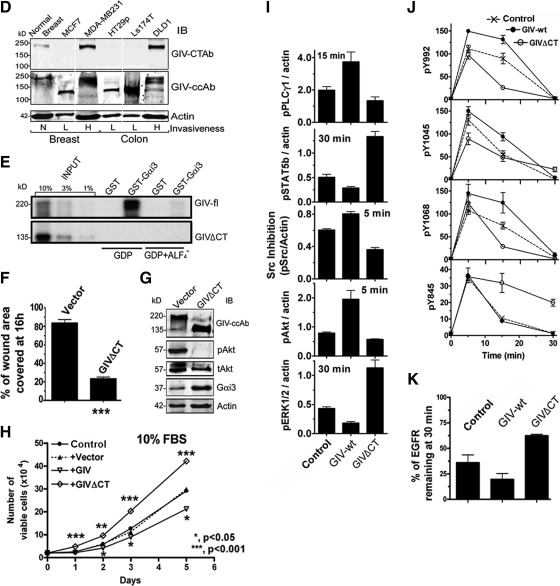
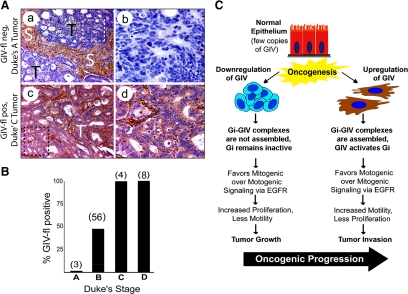
Cells respond to growth factors by either migrating or proliferating, but not both at the same time, a phenomenon termed migration-proliferation dichotomy. The underlying mechanism of this phenomenon has remained unknown. We demonstrate here that Galpha(i) protein and GIV, its nonreceptor guanine nucleotide exchange factor (GEF), program EGF receptor (EGFR) signaling and orchestrate this dichotomy. GIV directly interacts with EGFR, and when its GEF function is intact, a Galpha(i)-GIV-EGFR signaling complex assembles, EGFR autophosphorylation is enhanced, and the receptor's association with the plasma membrane (PM) is prolonged. Accordingly, PM-based motogenic signals (PI3-kinase-Akt and PLCgamma1) are amplified, and cell migration is triggered. In cells expressing a GEF-deficient mutant, the Galphai-GIV-EGFR signaling complex is not assembled, EGFR autophosphorylation is reduced, the receptor's association with endosomes is prolonged, mitogenic signals (ERK 1/2, Src, and STAT5) are amplified, and cell proliferation is triggered. In rapidly growing, poorly motile breast and colon cancer cells and in noninvasive colorectal carcinomas in situ in which EGFR signaling favors mitosis over motility, a GEF-deficient splice variant of GIV was identified. In slow growing, highly motile cancer cells and late invasive carcinomas, GIV is highly expressed and has an intact GEF motif. Thus, inclusion or exclusion of GIV's GEF motif, which activates Galphai, modulates EGFR signaling, generates migration-proliferation dichotomy, and most likely influences cancer progression.


Figures

Figure 1.
Figure 1.
A Gαi–GIV complex imparts migration-proliferation dichotomy by modulating motogenic and mitogenic signals initiated by EGFR. (A) GIV-wt cells preferentially migrate, whereas GIV-FA cells preferentially proliferate. Confluent monolayers of HeLa cells stably expressing either siRNA-resistant wild-type GIV (GIV-wt) or GEF-deficient GIV (GIV-FA) (see Supplemental Figure S1) were depleted of endogenous GIV, starved for 6–12 h in 0.2% FBS, scratch wounded, and then treated with 0.1 nM EGF. The edge of the wound was monitored by live cell imaging for 12 h (see Supplemental Movies 1 and 2). The total number of cells along the edge of the wound that demonstrated polarized migration into the wound or completed cell division in response to EGF were counted and expressed as the percent of cells analyzed. Bar graphs display the percent of GIV-wt versus GIV-FA cells that migrate (above) or divide (below) during the first 12 h. Results are shown as mean ± SEM (n = cells from 14 to 15 randomly chosen fields from one representative experiment). (B) Active Gαi3 (Q204L) promotes migration, whereas inactive Gαi3 (G203A) promotes mitosis. HeLa cells transfected with Gαi3wt-YFP, Gαi3(QL)-YFP, or Gi3(GA)-YFP were grown to confluence and stimulated by scratch wounding in the presence of 10% serum to initiate EGFR signaling (Tetreault et al., 2007). Cells were then imaged for 8 h as they migrated into the wound (see Supplemental Movies 3 and 4; as in A). Bar graphs display the percent of cells at the edge of the wound that migrate or divide. Results are shown as mean ± SEM (n = cells from 25 to 30 randomly chosen fields from 2 to 3 independent experiments). (C and D) GIV-wt cells enhance PLCγ1 and Akt and suppress c-Src, ERK1/2 and STAT5b signals in response to EGF, whereas GIV-FA cells show the opposite signaling profile. (C) Serum-starved GIV-wt, GIV-FA, and control (untransfected) HeLa cells were stimulated with 50 nM EGF, and whole cell lysates were analyzed for total (t)- and phospho (p)-PLCγ1, c-Src, Akt, ERK1/2, and STAT5b and actin by immunoblotting (IB). (D) Kinetics of EGF-initiated signaling pathways in HeLa cell lines determined by phospho-protein:actin ratios at each time point after EGF stimulation and expressed as fold increase in activation normalized to t = 0 min. Although all three cell lines achieved similar enhancement of phosphorylation of PLCγ1 at 5 min, this enhancement was sustained in GIV-wt but rapidly reduced in GIV-FA cells by 15 min. For STAT5b, phosphorylation was enhanced and sustained up to 30 min GIV-FA cells but not in GIV-wt cells. Inhibitory phosphorylation of Src at Y527 was increased in GIV-wt and suppressed in GIV-FA, but the ligand-dependent variations seen in control cells were lost in GIV-wt and GIV-FA cells. Phosphorylation of Akt was enhanced (peak at 5 min) in GIV-wt and suppressed in GIV-FA cells. Finally, the peak activity of ERK1/2 at 5 min was suppressed in GIV-wt but enhanced in GIV-FA; the latter also displayed sustained ERK activity until 30 min. Results are shown as mean ± SEM (n = 4); p < 0.05 for comparison between GIV-wt and GIV-FA with regard to ERK, Src, PLCγ1, and STAT5b at 15 min and for Akt at 5 min. (E) Summary of the effects of GIV's GEF function on EGF-initiated signaling pathways and the phenotypic outcome. In the presence of a Gi–GIV complex (GEF Active), motogenic cascades are preferentially enhanced and migration is triggered. In the absence of the complex (GEF Inactive), mitogenic cascades are preferentially enhanced and mitosis is triggered.
Figure 2.
Figure 2.
GIV's GEF function enhances autophosphorylation of EGFR and SH2 adaptor recruitment. (A) Schematic representation of EGFR showing tyrosine autophosphorylation sites and Src phosphorylation site in the cytoplasmic tail and the corresponding SH2 adaptors (PLCγ1, c-Cbl, and Grb2) that are specifically recruited to these sites. (B and C) GIV-wt and GIV-FA cells have distinct profiles of EGFR phosphorylation. (B) Serum-starved GIV-wt, GIV-FA, and control HeLa cells were stimulated with EGF as in described in Figure 1C, and whole cell lysates were analyzed for phospho-EGFR by using p-Tyr site-specific antibodies to Y845, Y992, Y1045, and Y1068 by immunoblotting (IB). GIV-wt cells showed increased EGFR autophosphorylation at Y992 at both 5 and 15 min and at Y1045 and Y1068 at 15 min, whereas GIV-FA cells showed sustained phosphorylation at Y845 at 15 and 30 min. (C) Receptor activation was quantified as described in Figure 1D and is expressed as fold increase in activation normalized to t = 0 min. Results are shown as mean ± SEM (n = 3). (D–H) Recruitment of SH2 adaptors to ligand-activated EGFR is enhanced in GIV-wt but inhibited in GIV-FA cells. Lysates of EGF-stimulated control, GIV-wt, and GIV-FA cells (prepared as in described in Figure 1C) were incubated with anti-EGFR (#225) IgG. Immunoprecipitated complexes were analyzed for adaptor recruitment by immunoblotting (IB) for pPLCγ1 (D), c-Cbl (E), and Grb2 (F). (G) Ratio of SH2 adaptor:tEGFR (y-axis) plotted over time (x-axis). The pPLCγ1:tEGFR and c-Cbl:t EGFR ratios are high in GIV-wt but low in GIV-FA cells at all time points (D and E) after ligand stimulation, whereas the Grb2:tEGFR ratio peaks to a similar extent in all cells at 5 min but is sustained at high levels in GIV-wt cells at 15 and 30 min (F). Results are representative of three separate experiments. (H) Successful immunoprecipitation of ligand-activated receptor in the above assays was confirmed using pY845 EGFR and anti-EGFR cytoplasmic tail (tEGFR).
Figure 2.
Figure 2.
GIV's GEF function enhances autophosphorylation of EGFR and SH2 adaptor recruitment. (A) Schematic representation of EGFR showing tyrosine autophosphorylation sites and Src phosphorylation site in the cytoplasmic tail and the corresponding SH2 adaptors (PLCγ1, c-Cbl, and Grb2) that are specifically recruited to these sites. (B and C) GIV-wt and GIV-FA cells have distinct profiles of EGFR phosphorylation. (B) Serum-starved GIV-wt, GIV-FA, and control HeLa cells were stimulated with EGF as in described in Figure 1C, and whole cell lysates were analyzed for phospho-EGFR by using p-Tyr site-specific antibodies to Y845, Y992, Y1045, and Y1068 by immunoblotting (IB). GIV-wt cells showed increased EGFR autophosphorylation at Y992 at both 5 and 15 min and at Y1045 and Y1068 at 15 min, whereas GIV-FA cells showed sustained phosphorylation at Y845 at 15 and 30 min. (C) Receptor activation was quantified as described in Figure 1D and is expressed as fold increase in activation normalized to t = 0 min. Results are shown as mean ± SEM (n = 3). (D–H) Recruitment of SH2 adaptors to ligand-activated EGFR is enhanced in GIV-wt but inhibited in GIV-FA cells. Lysates of EGF-stimulated control, GIV-wt, and GIV-FA cells (prepared as in described in Figure 1C) were incubated with anti-EGFR (#225) IgG. Immunoprecipitated complexes were analyzed for adaptor recruitment by immunoblotting (IB) for pPLCγ1 (D), c-Cbl (E), and Grb2 (F). (G) Ratio of SH2 adaptor:tEGFR (y-axis) plotted over time (x-axis). The pPLCγ1:tEGFR and c-Cbl:t EGFR ratios are high in GIV-wt but low in GIV-FA cells at all time points (D and E) after ligand stimulation, whereas the Grb2:tEGFR ratio peaks to a similar extent in all cells at 5 min but is sustained at high levels in GIV-wt cells at 15 and 30 min (F). Results are representative of three separate experiments. (H) Successful immunoprecipitation of ligand-activated receptor in the above assays was confirmed using pY845 EGFR and anti-EGFR cytoplasmic tail (tEGFR).
Figure 3.
Figure 3.
GIV's GEF function prolongs EGFR localization at the PM but enhances degradation upon internalization. (A) At 15 min after ligand (HRP-EGF) stimulation, ligand-bound EGFR localizes at the PM (e, arrowheads in h) in GIV-wt cells and within intracellular compartments (i and l) in GIV-FA cells. Starved control, GIV-wt, and GIV-FA cells were labeled and stimulated with 300 nM HRP-EGF (equivalent to 50 nM EGF) at 4°C (0 min), washed with PBS, and warmed to 37°C for 15 min. They were then fixed and costained with or without prior permeabilization for HRP, EEA1, and nucleus/DAPI, and visualized by confocal microscopy. Staining for HRP without permeabilization allows selective visualization of ligand-bound receptor at the PM (a–f), whereas permeabilization allows visualization of both the PM and intracellular pools of receptor (g–l). Bar, 10 μm. (B) In GIV-FA cells, EGFR maximally colocalizes with EEA1-positive endosomes at 15 min. GIV-FA cells were stimulated with HRP-EGF for 15 min as in Figure 3A, visualized by confocal microscopy, and analyzed for colocalization of EEA1 (green; a) and HRP (red; b) using Volocity software. The yellow pixels (c) showed significant overlap (Pearson's correlation = 0.45) between HRP-EGF and EEA1. Identical results were obtained when the C terminus of EGFR was stained instead of the ligand (arrows in d). Bar, 10 μm. (C) At 60 min after ligand stimulation, EGFR is virtually undetectable in GIV-wt cells (e and h) but significant staining is seen in GIV-FA cells (f and i) compared with controls (d and g). Cells were stimulated with 50 nM EGF for 60 min and costained for EEA1 (green), tEGFR (red; anti-EGFR cytoplasmic tail), and the nucleus/DAPI (blue). Bar, 10 μm. (D) EGFR degradation is delayed in GIV-FA cells. Serum-starved control, GIV-wt, and GIV-FA HeLa cells were stimulated for 30 min with 50 nM EGF as in Figure 1C and analyzed for total EGFR (tEGFR, anti-EGFR cytoplasmic tail) and actin by immunoblotting (IB; top). Band-shifts and doublets are consistently detected that correlate with phosphorylation of EGFR. Bottom, the amount of receptor (180 kDa, full length) present at 30 min was quantified by Odyssey infrared imaging, normalized to actin, and expressed as percent remaining compared with 0 min. Results are shown as mean ± SEM.
Figure 4.
Figure 4.
Gαi3, GIV, and EGFR form a ligand-regulated complex. (A) Endogenous Gαi3 and GIV coimmunoprecipitate with EGFR. Serum-starved HeLa cells were stimulated with 50 nM EGF for 5 min before lysis. Immunoprecipitation was carried out on equal aliquots of cell lysates (left) using anti-EGFR (#225, Lanes 2 and 3) and pre-immune (Lane 1) IgGs, and the bound immune complexes were analyzed for tEGFR, Gαi3, and GIV by immunoblotting (IB; right). Receptor activation was confirmed by immunoblotting for pEGFR (Y845). (B) Endogenous GIV and EGFR partially colocalize at the cell periphery upon ligand stimulation. Starved HeLa cells were stimulated with EGF for 5 min, fixed, stained for pY845 EGFR (a; green), GIV (b; red), and the nucleus/DAPI (blue) and analyzed by confocal microscopy. Merged image (c) shows patches at the PM where GIV and EGFR colocalize (yellow, arrowheads; Pearson's correlation = 0.50; overlap coefficient = 0.50). Inset in d is a scatter-plot of red and green pixels at the PM, generated using Volocity software. Bar, 10 μm. (C) Endogenous Gαi3 and EGFR partially colocalize at the cell periphery upon ligand stimulation. Starved HeLa cells were treated as described in B and stained for activated (pY845) EGFR (a; green), Gαi3 (b; red), and the nucleus/DAPI (blue), and analyzed by confocal microscopy. Merged image (c) shows patches at the PM where Gαi3 and EGFR colocalize (arrowheads, yellow; Pearson's correlation = 0.69; overlap coefficient = 0.69). A scatter plot (d) of red and green pixels at the PM was generated as described in B. Bar, 10 μm. (D) GIV's N terminus constitutively interacts with EGFR. Cos7 cells cotransfected with FLAG-EGFR and a truncated GIV construct (GIV-NT) lacking the C terminus (∼520 aa) were serum starved or treated with EGF, and immunoprecipitation was carried out on cell lysates using anti-FLAG IgG. Left, Cos7 lysates (Input) show expression of GIV-NT and FLAG-EGFR by immunoblotting (IB). RIGHT: Immunoprecipitates analyzed for EGFR and GIV-NT by IB. GIV-NT interacts with EGFR both before (lane 2) and after (lane 3) EGF stimulation. (E) GIV's C terminus (GIV-CT) interacts only with activated EGFR. FLAG-EGFR was immunopurified from starved (SS) or stimulated (EGF) Cos7 cells as described in D followed by incubation of the bead-bound receptor with purified His-GIV-CT (aa 1623–1870) overnight. Bound proteins were analyzed for FLAG-EGFR, His-GIV-CT, and Gαi3, and actin by IB. Gαi3-3XFLAG (lane 6), which is known to interact with GIV-CT (Garcia-Marcos et al., 2009), was used as a positive control. His-GIV-CT binds to the activated EGFR (lane 5) and Gαi3 (lane 6), but not to the inactive receptor (lane 4). (F and G) The C terminus of GIV directly interacts with the phosphorylated cytoplasmic tail of EGFR (EGFR-T). Equal aliquots (15 μg) of GST or GST-EGFR-T (aa 1064–1210) were phosphorylated in vitro using 5 ng of recombinant EGFR kinase and used in pull-down assays with purified His-GIV-CT (aa 1660–1870) (F) or His-Gαi3 (G). Bound proteins were visualized by IB for His, and phosphorylation of EGFR was confirmed by immunoblotting for pTyr. Phosphorylated but not unphosphorylated GST-EGFR-T directly binds His-GIV-CT (F; right lane) but not His-Gαi3 (G; right lane). (H) GIV's GEF motif is required for ligand-stimulated recruitment of Gαi3 and actin to EGFR. Lysates prepared from EGF-stimulated GIV-wt and GIV-FA cells (as described in Figure 1C) were incubated with anti-EGFR (#225) IgG (as described in Figure 2, D–G), and immune complexes were analyzed for tEGFR, phosphorylated (pY845) EGFR, Gαi3, and actin by IB. Gαi3 and actin coimmunoprecipitated with EGFR in GIV-wt (top) but not in GIV-FA cells (bottom) at 5 and 15 min. (I) Working model summarizing findings in A–H. In the starved state, GIV interacts with inactive EGFR (left) through its N terminus, whereas activation of EGFR (right) triggers a regulated interaction between the receptor tail and GIV's C terminus, thereby coupling the receptor tail to G protein signaling at the PM. NT and CT domains of GIV and the G protein are illustrated (bottom).
Figure 4.
Figure 4.
Gαi3, GIV, and EGFR form a ligand-regulated complex. (A) Endogenous Gαi3 and GIV coimmunoprecipitate with EGFR. Serum-starved HeLa cells were stimulated with 50 nM EGF for 5 min before lysis. Immunoprecipitation was carried out on equal aliquots of cell lysates (left) using anti-EGFR (#225, Lanes 2 and 3) and pre-immune (Lane 1) IgGs, and the bound immune complexes were analyzed for tEGFR, Gαi3, and GIV by immunoblotting (IB; right). Receptor activation was confirmed by immunoblotting for pEGFR (Y845). (B) Endogenous GIV and EGFR partially colocalize at the cell periphery upon ligand stimulation. Starved HeLa cells were stimulated with EGF for 5 min, fixed, stained for pY845 EGFR (a; green), GIV (b; red), and the nucleus/DAPI (blue) and analyzed by confocal microscopy. Merged image (c) shows patches at the PM where GIV and EGFR colocalize (yellow, arrowheads; Pearson's correlation = 0.50; overlap coefficient = 0.50). Inset in d is a scatter-plot of red and green pixels at the PM, generated using Volocity software. Bar, 10 μm. (C) Endogenous Gαi3 and EGFR partially colocalize at the cell periphery upon ligand stimulation. Starved HeLa cells were treated as described in B and stained for activated (pY845) EGFR (a; green), Gαi3 (b; red), and the nucleus/DAPI (blue), and analyzed by confocal microscopy. Merged image (c) shows patches at the PM where Gαi3 and EGFR colocalize (arrowheads, yellow; Pearson's correlation = 0.69; overlap coefficient = 0.69). A scatter plot (d) of red and green pixels at the PM was generated as described in B. Bar, 10 μm. (D) GIV's N terminus constitutively interacts with EGFR. Cos7 cells cotransfected with FLAG-EGFR and a truncated GIV construct (GIV-NT) lacking the C terminus (∼520 aa) were serum starved or treated with EGF, and immunoprecipitation was carried out on cell lysates using anti-FLAG IgG. Left, Cos7 lysates (Input) show expression of GIV-NT and FLAG-EGFR by immunoblotting (IB). RIGHT: Immunoprecipitates analyzed for EGFR and GIV-NT by IB. GIV-NT interacts with EGFR both before (lane 2) and after (lane 3) EGF stimulation. (E) GIV's C terminus (GIV-CT) interacts only with activated EGFR. FLAG-EGFR was immunopurified from starved (SS) or stimulated (EGF) Cos7 cells as described in D followed by incubation of the bead-bound receptor with purified His-GIV-CT (aa 1623–1870) overnight. Bound proteins were analyzed for FLAG-EGFR, His-GIV-CT, and Gαi3, and actin by IB. Gαi3-3XFLAG (lane 6), which is known to interact with GIV-CT (Garcia-Marcos et al., 2009), was used as a positive control. His-GIV-CT binds to the activated EGFR (lane 5) and Gαi3 (lane 6), but not to the inactive receptor (lane 4). (F and G) The C terminus of GIV directly interacts with the phosphorylated cytoplasmic tail of EGFR (EGFR-T). Equal aliquots (15 μg) of GST or GST-EGFR-T (aa 1064–1210) were phosphorylated in vitro using 5 ng of recombinant EGFR kinase and used in pull-down assays with purified His-GIV-CT (aa 1660–1870) (F) or His-Gαi3 (G). Bound proteins were visualized by IB for His, and phosphorylation of EGFR was confirmed by immunoblotting for pTyr. Phosphorylated but not unphosphorylated GST-EGFR-T directly binds His-GIV-CT (F; right lane) but not His-Gαi3 (G; right lane). (H) GIV's GEF motif is required for ligand-stimulated recruitment of Gαi3 and actin to EGFR. Lysates prepared from EGF-stimulated GIV-wt and GIV-FA cells (as described in Figure 1C) were incubated with anti-EGFR (#225) IgG (as described in Figure 2, D–G), and immune complexes were analyzed for tEGFR, phosphorylated (pY845) EGFR, Gαi3, and actin by IB. Gαi3 and actin coimmunoprecipitated with EGFR in GIV-wt (top) but not in GIV-FA cells (bottom) at 5 and 15 min. (I) Working model summarizing findings in A–H. In the starved state, GIV interacts with inactive EGFR (left) through its N terminus, whereas activation of EGFR (right) triggers a regulated interaction between the receptor tail and GIV's C terminus, thereby coupling the receptor tail to G protein signaling at the PM. NT and CT domains of GIV and the G protein are illustrated (bottom).
Figure 5.
Figure 5.
Full-length GIV is expressed in highly invasive, but not in poorly invasive, cancer cells. (A and B) Full-length GIV (GIV-fl) is detectable only in highly invasive variants of breast and colon carcinoma cells. Lysates of colon (A) and breast (B) cancer cell lines with low or high invasiveness were analyzed for expression of GIV-fl (using GIV-CTAb), Gαi3, and actin by immunoblotting (IB; top) and for GIV and GAPDH mRNA by RT-PCR (bottom). (C) GIV transcript is up-regulated in highly invasive and down-regulated in poorly invasive cancer cells. The relative abundance of amplified cDNA products spanning the C terminus (see Supplemental Figure S5A) in RT-PCR assays (35 cycles) on several colon, breast, and skin cancer cells is expressed as fold change compared with their respective normal controls. GIV was up-regulated ∼3- to 30-fold in highly motile cells (green bars) and down-regulated ∼5- to 12-fold in poorly invasive cells (red bars).
Figure 6.
Figure 6.
Poorly invasive cancer cells express an alternatively spliced C-terminal truncated GIV protein (GIVΔCT) that fails to bind Gαi3 and enhances mitosis in response to EGF. (A) Retention of intron 19 in GIV mRNA occurs exclusively in poorly invasive cancer cells. RT-PCR was carried out on mRNA isolated from normal (N) and colon and breast cancer cells with high (H) or low (L) invasiveness by using exon 19 forward and exon 20 reverse primers (primer sequences available upon request). Although normal (N) cells and highly (H) metastatic cells yielded the expected ∼250-bp PCR product, poorly (L) invasive cells yielded a larger ∼1250-bp product. (B) Percent of intron retention varies among poorly invasive cancer cells. The percent of IR (calculated as [GIV mRNA retaining intron 19]/[GIV mRNA retaining intron 19 + GIV mRNA with intron 19 processed] × 100) was variable across cell lines: ∼95, ∼85, and ∼50–60% in Ls-174T, HT29, and MCF7 cells, respectively. (C) Proposed scheme for the generation of GIV-IR19 isoform with an in-frame stop codon by alternative splicing of GIV pre-mRNA. Shown are the constitutive and alternative pre-mRNA splicing events, the corresponding GIV mRNA isoforms (GIV and GIV-IR19) generated, the translated amino acid (AA) sequences, and the predicted 220-and 135-kDa protein products (GIV and GIVΔCT). PTC, premature stop codon. (D) A C-terminal truncated protein (GIVΔCT) is expressed exclusively in poorly invasive cells with low metastatic potential. Lysates of normal breast (N) or cancer cells with low (L) or high (H) metastatic potential were immunoblotted (IB) for GIV using GIV-CTAb (against the C-terminal 18 aa of GIV) and GIV-ccAb (against the coiled-coil domain of GIV) and actin. An ∼135-kDa truncated protein is expressed in cells with low (L) invasive potential, whereas GIV-fl is expressed in cells with high (H) invasive potential. (E) GIV-fl, but not GIVΔCT binds to GDP-bound Gαi3. In vitro-translated, [35S]Met-labeled full-length GIV (aa1-1870; top) and GIVΔCT (aa1-1354; bottom) were incubated with ∼15 μg of GST-Gαi3 or GST immobilized on glutathione-agarose beads in the presence of GDP or GDP · AlF4. Bound GIV was quantified by autoradiography. GIV-fl bound Gαi3 preferentially in the presence of GDP as shown previously (Garcia-Marcos et al., 2009), whereas GEF-deficient GIVΔCT showed no binding. (F–H) GIVΔCT cells proliferate but do not migrate or enhance Akt in scratch wound assays. (F) Confluent monolayers of HeLa cells stably expressing GIVΔCT or vector controls were induced to migrate by scratch wounding, and the area of wound covered at 16 h was quantified as described in Figure 1A. Results are expressed as mean ± SEM, n = 3. (G) Lysates prepared from cells in F were analyzed for GIV, pAkt, tAkt, Gαi3, and actin by IB. (H) Growth curves for cells lines stably expressing GIV-wt (▿), GIVΔCT (♢), vector (▴) or control HeLa (●) in media supplemented with 10% serum. (I) GIVΔCT inhibits motogenic signals but enhances mitogenic signals in response to EGF. GIVΔCT, GIV-wt, and control HeLa cells were stimulated with 50 nM EGF for the indicated times, and analyzed as described in Figure 1, C and D. pAkt, pPLCγ1, c-Src, pERK1/2, and STAT5b were quantified by Odyssey infrared imaging, normalized to actin, and expressed as fold change compared with untransfected controls. Results are shown as mean ± SEM, n = 3. (J and K) GIVΔCT inhibits EGFR autophosphorylation and delays receptor down-regulation in response to EGF. (J) Extent of receptor phosphorylation at Y992, Y1045, Y1068, and Y845 was measured as described in Figure 2C and expressed as fold increase in activation at 30 versus 0 min. Results are shown as mean ± SEM, n = 4. (K) GIVΔCT, GIV-wt, and control HeLa cells were stimulated with 50 nM EGF as described above and analyzed as described in Figure 3D and expressed as %EGFR remaining at 30 min versus 0 min.
Figure 6.
Figure 6.
Poorly invasive cancer cells express an alternatively spliced C-terminal truncated GIV protein (GIVΔCT) that fails to bind Gαi3 and enhances mitosis in response to EGF. (A) Retention of intron 19 in GIV mRNA occurs exclusively in poorly invasive cancer cells. RT-PCR was carried out on mRNA isolated from normal (N) and colon and breast cancer cells with high (H) or low (L) invasiveness by using exon 19 forward and exon 20 reverse primers (primer sequences available upon request). Although normal (N) cells and highly (H) metastatic cells yielded the expected ∼250-bp PCR product, poorly (L) invasive cells yielded a larger ∼1250-bp product. (B) Percent of intron retention varies among poorly invasive cancer cells. The percent of IR (calculated as [GIV mRNA retaining intron 19]/[GIV mRNA retaining intron 19 + GIV mRNA with intron 19 processed] × 100) was variable across cell lines: ∼95, ∼85, and ∼50–60% in Ls-174T, HT29, and MCF7 cells, respectively. (C) Proposed scheme for the generation of GIV-IR19 isoform with an in-frame stop codon by alternative splicing of GIV pre-mRNA. Shown are the constitutive and alternative pre-mRNA splicing events, the corresponding GIV mRNA isoforms (GIV and GIV-IR19) generated, the translated amino acid (AA) sequences, and the predicted 220-and 135-kDa protein products (GIV and GIVΔCT). PTC, premature stop codon. (D) A C-terminal truncated protein (GIVΔCT) is expressed exclusively in poorly invasive cells with low metastatic potential. Lysates of normal breast (N) or cancer cells with low (L) or high (H) metastatic potential were immunoblotted (IB) for GIV using GIV-CTAb (against the C-terminal 18 aa of GIV) and GIV-ccAb (against the coiled-coil domain of GIV) and actin. An ∼135-kDa truncated protein is expressed in cells with low (L) invasive potential, whereas GIV-fl is expressed in cells with high (H) invasive potential. (E) GIV-fl, but not GIVΔCT binds to GDP-bound Gαi3. In vitro-translated, [35S]Met-labeled full-length GIV (aa1-1870; top) and GIVΔCT (aa1-1354; bottom) were incubated with ∼15 μg of GST-Gαi3 or GST immobilized on glutathione-agarose beads in the presence of GDP or GDP · AlF4. Bound GIV was quantified by autoradiography. GIV-fl bound Gαi3 preferentially in the presence of GDP as shown previously (Garcia-Marcos et al., 2009), whereas GEF-deficient GIVΔCT showed no binding. (F–H) GIVΔCT cells proliferate but do not migrate or enhance Akt in scratch wound assays. (F) Confluent monolayers of HeLa cells stably expressing GIVΔCT or vector controls were induced to migrate by scratch wounding, and the area of wound covered at 16 h was quantified as described in Figure 1A. Results are expressed as mean ± SEM, n = 3. (G) Lysates prepared from cells in F were analyzed for GIV, pAkt, tAkt, Gαi3, and actin by IB. (H) Growth curves for cells lines stably expressing GIV-wt (▿), GIVΔCT (♢), vector (▴) or control HeLa (●) in media supplemented with 10% serum. (I) GIVΔCT inhibits motogenic signals but enhances mitogenic signals in response to EGF. GIVΔCT, GIV-wt, and control HeLa cells were stimulated with 50 nM EGF for the indicated times, and analyzed as described in Figure 1, C and D. pAkt, pPLCγ1, c-Src, pERK1/2, and STAT5b were quantified by Odyssey infrared imaging, normalized to actin, and expressed as fold change compared with untransfected controls. Results are shown as mean ± SEM, n = 3. (J and K) GIVΔCT inhibits EGFR autophosphorylation and delays receptor down-regulation in response to EGF. (J) Extent of receptor phosphorylation at Y992, Y1045, Y1068, and Y845 was measured as described in Figure 2C and expressed as fold increase in activation at 30 versus 0 min. Results are shown as mean ± SEM, n = 4. (K) GIVΔCT, GIV-wt, and control HeLa cells were stimulated with 50 nM EGF as described above and analyzed as described in Figure 3D and expressed as %EGFR remaining at 30 min versus 0 min.
Figure 7.
Figure 7.
In colorectal carcinomas, expression of GIV-fl is suppressed in early stages of noninvasive tumor growth and increased in late stages of tumor invasion. (A) Cells deficient in GIV-fl dominate noninvasive tumors, whereas those with increased GIV-fl are found in invasive tumors. Paraffin embedded human colon cancer samples were analyzed for GIV-fl by immunohistochemistry using GIV-CTAb. Panels on the left display representative fields from either noninvasive (Duke's A) tumors of early clinical stage (a and b) or invasive (Duke's C/D) tumors of late clinical stages (c and d). Noninvasive Duke's A tumor cells (T; a and b) stain negatively for GIV-fl whereas invasive Duke's C and D tumors (c and d) are strongly positive (d). Stroma (S) consistently stained strongly positive in all tumors irrespective of their clinical stage/invasiveness. b and d are higher magnification views of the boxed regions on the left. (B) Percentage of GIV-fl–positive tumors increases with increasing clinical stage of colorectal carcinoma. GIV expression was analyzed in tumors (as in A) of variable clinical stages by three independent observers with >95% congruence. Bar graphs comparing the proportion of tumors that were scored as positive for full-length GIV expression within each Duke's clinical stage: 0% for Dukes A, ∼48% for B, and 100% for C and D. The total number of tumors examined within each clinical stage is indicated in parentheses. (C) Working model. Expression of GIV-fl undergoes bipartite dysregulation during oncogenesis. In some cancer cells (left), GIV is down-regulated by alternative splicing such that these cells cannot assemble functional Gαi–GIV complexes and fail to activate Gαi. Consequently, EGF signaling is programmed such that mitogenic signals are favored over motogenic pathways. This pattern of signal transduction triggers mitosis and suppresses migration/invasion. By contrast, in other cancer cells (right) the GIV-fl transcript and protein are up-regulated. In these cells functional Gαi–GIV complexes are assembled, via which GIV activates Gαi, and EGF-signaling is programmed such that motogenic signals are preferentially amplified over mitogenic pathways. This pattern of signal transduction triggers migration/invasion and suppresses mitosis in cells overexpressing GIV-fl. The highly proliferative cells in which GIV is down-regulated dominate the noninvasive tumor first and highly invasive cells in which GIV-fl is up-regulated are enriched later during metastatic invasion, suggesting that GIV may influence tumor growth and invasiveness during oncogenic progression.

References

    1. Anai M., et al. A novel protein kinase B (PKB)/AKT-binding protein enhances PKB kinase activity and regulates DNA synthesis. J. Biol. Chem. 2005;280:18525–18535. - PubMed
    1. Athale C., Mansury Y., Deisboeck T. S. Simulating the impact of a molecular ‘decision-process’ on cellular phenotype and multicellular patterns in brain tumors. J. Theor. Biol. 2005;233:469–481. - PubMed
    1. Ausprunk D. H., Folkman J. Migration and proliferation of endothelial cells in preformed and newly formed blood vessels during tumor angiogenesis. Microvasc. Res. 1977;14:53–65. - PubMed
    1. Bagrodia S., Chackalaparampil I., Kmiecik T. E., Shalloway D. Altered tyrosine 527 phosphorylation and mitotic activation of p60c-src. Nature. 1991;349:172–175. - PubMed
    1. Band V., Zajchowski D., Swisshelm K., Trask D., Kulesa V., Cohen C., Connolly J., Sager R. Tumor progression in four mammary epithelial cell lines derived from the same patient. Cancer Res. 1990;50:7351–7357. - PubMed

Publication types

MeSH terms

Substances