. 2010 Jul 1;21(13):2172-81.
doi: 10.1091/mbc.e09-12-1026. Epub 2010 May 12.

Free edges in epithelial cell sheets stimulate epidermal growth factor receptor signaling

Affiliations

Free edges in epithelial cell sheets stimulate epidermal growth factor receptor signaling

Ethan R Block et al. Mol Biol Cell. .

Abstract

The ability of epithelia to migrate and cover wounds is essential to maintaining their functions as physical barriers. Wounding induces many cues that may affect the transition to motility, including the immediate mechanical perturbation, release of material from broken cells, new interactions with adjacent extracellular matrix, and breakdown of physical separation of ligands from their receptors. Depending on the exact nature of wounds, some cues may be present only transiently or insignificantly. In many epithelia, activation of the epidermal growth factor receptor (EGFR) is a central event in induction of motility, and we find that its continuous activation is required for progression of healing of wounds in sheets of corneal epithelial cells. Here, we examine the hypothesis that edges, which are universally and continuously present in wounds, are a cue. Using a novel culture model we find that their presence is sufficient to cause activation of the EGFR and increased motility of cells in the absence of other cues. Edges that are bordered by agarose do not induce activation of the EGFR, indicating that activation is not due to loss of any specific type of cell-cell interaction but rather due to loss of physical constraints.


Figures

Figure 1.
Figure 1.
Continuous EGFR signaling is required for progression of wound healing. (A) Time course of activation of the EGFR and ERK1/2 after wounding. The blots were cut and relevant areas probed with antibodies to phospho-EGFR(1173), phospho-ERK1/2(204), or β-actin as a load control. The blots were then stripped and blotted with antibodies to total EGFR or ERK1. (B) Quantitation of down-regulation and activation of the EGFR after wounding. Asterisk (*) indicates significant differences from controls according to Student's t test (n = 6; p < 0.001). (C) Inhibition of EGFR signaling blocks ERK1/2 activation immediately and long after wounding. 1 μM tyrphostin AG 1478 was added 30 min before analysis. (D) Effects of blocking EGFR signaling at various times after wounding. Healing was measured after 0, 5, 10, 15, and 30 h. Where indicated, 1 μM tyrphostin AG 1478 was added at the indicated times, and the cells were allowed to heal for a total of 30 h (n = 6). (E) EGF is required continuously for acceleration of wound healing. EGF (4 nM) was added for the initial hour or continuously during wound healing. Asterisk (*) indicates significant difference from control according to Student's t-test (n = 7; p < 0.001). (F) EGFR signaling is dispensable during the initial hour after wounding. Tyrphostin AG 1478 (1 μM) was added for the first hour where indicated, and then the cells were washed and allowed to heal for the indicated times (n = 6). In this and the following figures, the values in the graphs are means and error bars are SDs. All experiments were performed at least three times with similar results.
Figure 2.
Figure 2.
Tissue culture model for determination of the effects of free edges. (A) Schematic of plates covered with polyHEMA and plastic strips. Light gray, polyHEMA; dark gray, plastic; inset, phase contrast microscopy of HCLE cells grown on plastic strips. (B) The cells at edges of plastic strips were stained with Alexa Fluor 546-conjugated phalloidin or anti-E-cadherin antibodies. (C) The plastic strips and polyHEMA were labeled with flourophores (green and blue, respectively), and the cells were labeled with the membrane dye Vybrant DiD (depicted in red). (D) No significant differences were detected between the uptake of thymidine in cells grown on strips or as uninterrupted sheets (n = 6). (E) Expression of Ki67 protein was analyzed by immunoblots and appears as a high-molecular-weight smear. (F) Release of lactate dehydrogenase (LDH) was measured from HCLE cells grown on strips or corresponding controls (n = 4). For comparison, multiple scratches were introduced into confluent HCLE cell layers with a pipette tip. AU, arbitrary units.
Figure 3.
Figure 3.
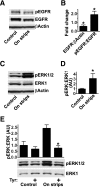
Activation of the EGFR and ERK1/2 by free edges. (A) Immunoblot of extracts with an antibody against EGFR phosphorylated on tyr-1173. The blots were stripped and reprobed with antibodies that recognize total amounts of the EGFR. The same blots were also probed with an antibody against β-actin as load control. (B) Quantitation of immunoblots by densitometry. Asterisk (*) indicates significant differences from controls by Student's t-test (n = 6; p < 0.001). (C) Extracts were stained with an antibody against ERK1/2 phosphorylated on tyr-204. The blots were stripped, and reprobed with antibodies that recognize total amounts of ERK1. (D) Quantitation as in B (n = 6; p < 0.001). (E) The EGFR controls ERK1/2 activation in cells grown on strips. Cells were treated with 1 μM tyrphostin AG 1478 30 min before harvest.
Figure 4.
Figure 4.
ERK1/2 are activated as a result of proteolytic activation of ligands for the EGFR, and activation occurs locally at free edges. (A) Cells were incubated with GM 6001 negative control (GM neg), GM 6001 (GM), nonimmune immunoglobulin (NI-IgG), or the LA1 antibody as indicated. The presence of GM 6001 did not affect EGFR phosphorylation by added EGF (Block et al., 2004; data not shown). Asterisk (*) indicates significant differences from controls after one-way analysis of variance and the Bonferroni test for multiple comparisons (n = 3; p < 0.001). (B) Inhibition of AR release by GM 6001. See Materials and Methods for experimental details (n = 4). (C) Regions (0.5 cm) of HCLE cells were analyzed at various distances from an unconstrained edge. “Control” is a similar strip taken from a confluent culture. Asterisk (*) indicates significant differences according to the Bonferroni test for multiple comparisons (n = 7; p < 0.001).
Figure 5.
Figure 5.
Edges do not stimulate EGFR activation through extracellular ATP signaling or through disruption of ligand/receptor segregation. (A) ATP levels in supernatants of cells grown under control conditions, on strips, or on strips and treated with 5 U/ml apyrase (Apy) for 3 h (n = 6). (B) Titration of activation of the EGFR by ATP. ATP was added for 10 min before harvest of the cells. Significant differences from controls are indicated by asterisks. Apy, 5 U/ml apyrase was added to the cells either alone or with 100 μM ATP (n = 3). (C) Transfer of supernatants from cells grown on strips does not induce activation of the EGFR. Cells grown as confluent controls or as strips were incubated for 24 h with starvation medium, and supernatants were collected and incubated on separately starved cells for 10 min. The data are normalized to transfer of starvation medium that was not incubated on cells. (D) Removal of ATP by treatment with 5 U/ml apyrase for 3 h does not result in any significant changes in the activation state of ERK1/2 in cells grown on plastic strips (n = 6). (E) HCLE cells were cultured on plastic-covered polyHEMA and were stained with an antibody to ZO-1. The activity of the antibody was verified by staining tight junctions in sections of mouse corneas (data not shown). Confocal microscopy was performed, and a representative xy and xz projection is shown. (F) Cells cultured on plastic-covered polyHEMA were untreated or treated with 100 ng/ml EGF for 2 min before fixation and analysis of phosphorylated EGFR by immunofluorescence confocal microscopy. Representative projections from xy and xz planes are shown.
Figure 6.
Figure 6.
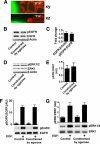
Edges that are physically constrained do not activate the EGFR. (A) Cells were labeled with the membrane dye Vybrant DiD (red), and agarose droplets were labeled with fluorescein (green). The plastic below the cells was left unlabeled for clarity. (B–E) Immunoblots of extracts of HCLE cells cultured without and with agarose droplets. The blots were probed as described in Figure 3, A–D. (F and G) Stimulation of HCLE cells grown either as uninterrupted sheets or around agarose droplets with 10 ng/ml EGF for 10 min results in similar levels of EGFR and ERK1/2 activation.
Figure 7.
Figure 7.
Motility of cells growing on plastic strips. (A) Representative trajectories of cells during a 4.5-h period are indicated (also see Supplemental Video 1). (B) Trajectories of 25 or 29 cells were followed, respectively. Asterisk (*) indicates significant difference from control (p < 0.001). (C) Close-up of movement of cells at edge of plastic strips. Note the extensions of lamellipodia- and ruffle-like structures (top and bottom arrow, respectively). Also see Supplemental Video 2.
Figure 8.
Figure 8.
Full production of MMP9 requires cues in addition to the presence of edges. (A) Effect of removal of agarose droplets. MMP9 in medium incubated 24 h on cells grown among agarose droplets, and in supernatants collected 0–24 or 24–48 h after removal of agarose droplets (day 1 and 2, respectively). Mock-removal from cultures without agarose droplets did not result in enhanced secretion of MMP9 (data not shown). Also shown are levels of MMP9 in medium incubated 24 h on cells grown on plastic strips. Asterisk (*) indicates significant differences from controls by Student's t test (n = 5; p < 0.001). (B) Levels of MMP9 in cultures treated as indicated were compared with untreated controls, and the fold change was plotted. Cells were treated with tyrphostin AG 1478, nonimmune immunoglobulin (Ig)G, or the LA1 antibody. Asterisk (*) indicates significant differences from controls according to one-way analysis of variance and the Bonferroni test for multiple comparisons (n = 3; p < 0.001).

Similar articles

Cited by

References

    1. Abercrombie M. Contact inhibition and malignancy. Nature. 1979;281:259–262. - PubMed
    1. Bindschadler M., McGrath J. L. Sheet migration by wounded monolayers as an emergent property of single-cell dynamics. J. Cell Sci. 2007;120:876–884. - PubMed
    1. Bjorklund M., Koivunen E. Gelatinase-mediated migration and invasion of cancer cells. Biochim. Biophys. Acta. 2005;1755:37–69. - PubMed
    1. Block E. R., Klarlund J. K. Wounding sheets of epithelial cells activates the epidermal growth factor receptor through distinct short- and long-range mechanisms. Mol. Biol. Cell. 2008;19:4909–4917. - PMC - PubMed
    1. Block E. R., Matela A. R., SundarRaj N., Iszkula E. R., Klarlund J. K. Wounding induces motility in sheets of corneal epithelial cells through loss of spatial constraints: role of heparin-binding epidermal growth factor-like growth factor signaling. J. Biol. Chem. 2004;279:24307–24312. - PubMed

Publication types

MeSH terms

Substances